
USDSGD Technical Analysis for Singapore
Contents
Introduction
IQOption broker has seen USDSGD investors making gains against the U.S. dollar for some months since the COVID-19 pandemic started worldwide.
The effect had caused recession across the globe leaving many sectors of businesses to go down. However, the various economies are on the recovery process as international companies open up.
Singapore Fundamentals
The core inflation shows the changes in price that the consumer pays for consumable goods, excluding accommodation and cars easily influenced by government policies.
The Singapore minister of health announces plans on the new COVID-19 antigen rapid tests, which can return with a reasonably accurate result within 15 minutes.
The countries plan to open up its economy to the world for international business. Singapore Airlines also plans to resume its nonstop international flight from Singapore to New York from the 9th of November.
U.S. Fundamentals
Flash Manufacturing PMI
This survey was carried out among various managers who rated the relative levels of businesses, inventories, supplier deliveries, among other samples.
When the actual data is greater than the forecast, it is suitable for the U.S. dollar, while a report lower than the expected will mean a bearish move against the currency.
Flash manufacturing PMI forecast is 53.5 while the previous is 53.2.
USDSGD Technical Analysis
USDSGD Long term Outlook: Bullish
Monthly Chart

Monthly Resistances: 1.46470, 1.41078
Monthly Supports: 1.32854, 1.35425
The monthly chart shows that the Singapore foreign exchange had been strengthened for the past three months amid the COVID-19 pandemic since the U.S. dollar had been weak globally in the financial market.
We are likely to see the USDSGD pair have a correction of the earlier trend as the pair finds support around 1.35425 levels, which will likely be supported by the stochastic Indicator for an upward move.
Weekly Charts

Weekly Resistance Levels:1.42688, 1.38160, 1.46463, 1.43296, 1.38240,
Weekly Support Levels: 1.3445, 1.38040, 1.39350, 1.35259.
The weekly candle closed bullish with an engulfing pattern, which indicates the sign of bulls taking a long position for an uptrend to target the previous support level turned resistance (1.41234). The Indicator is at the oversold region, and the rise shows a rising momentum in the price for a possible bullish rally.
Due to the 1.38240 resistance levels, we will likely have a minor pullback before the pair continues to rise towards the 1.42688 zones in the coming weeks.
USDSGD Medium Term Outlook: Bullish
Daily Charts
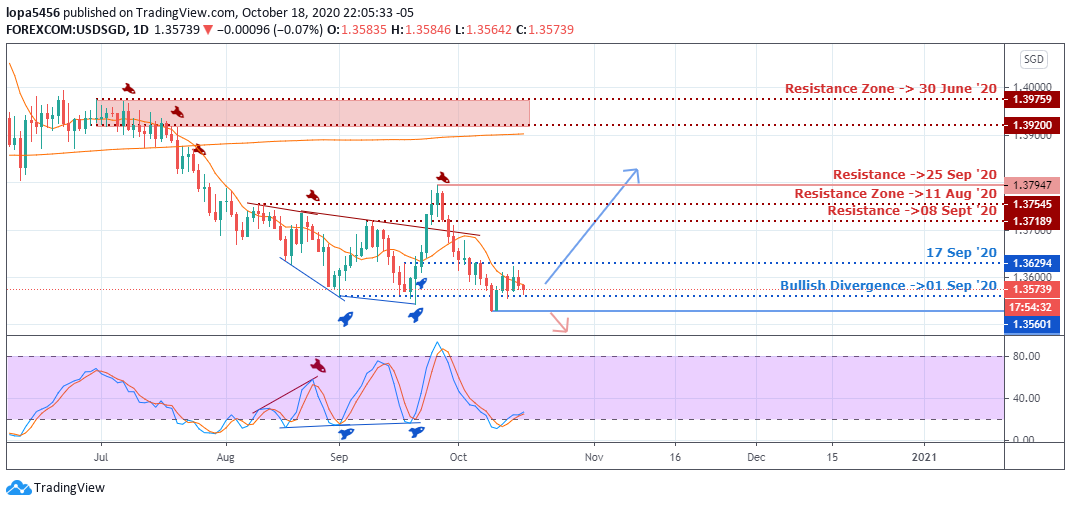
Daily Resistance Levels: 1.39759, 1.37545, 1.3920, 1.38160,
Daily Support Levels: 1.35601, 1.37189, 1.36294
A breakout move above the daily trend line (Neckline) shows that the bulls are set to push the price higher after forming the double bottom pattern.
Over time, we expect the 1.37545 zones to support as price retests that area, pushing the price to the 1.39759 and 1.3920 resistance levels.
If the bearish move should go below the 1.36294 support levels, the Singapore brokers should expect the bears to close below the 1.35601 which will continue the bearish trend.
H4 Charts
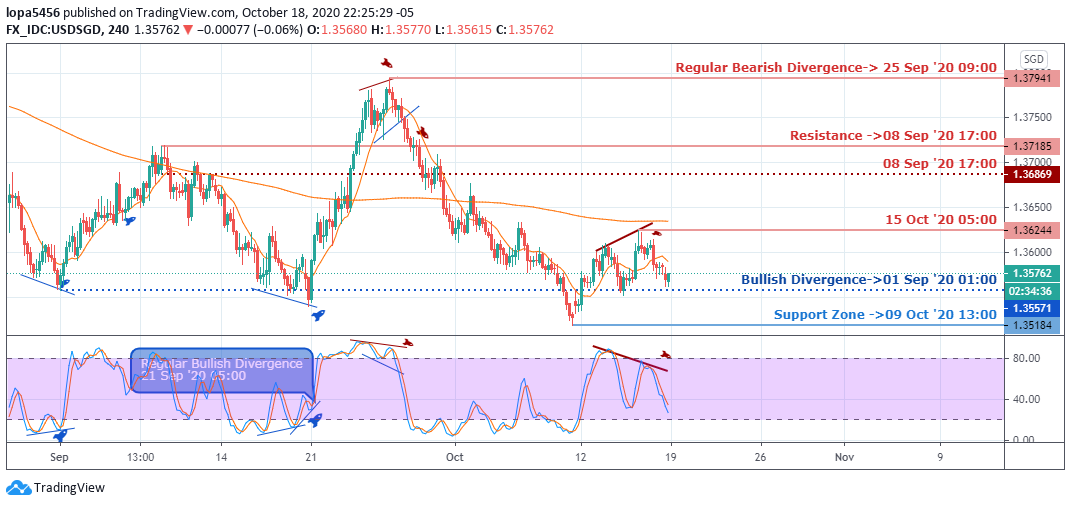
4Hour Resistance Levels: 1.38340, 1.3775, 1.37745, 1.38732,
4Hour Support Levels: 1.36258, 1.36869, 1.37395, 1.35571
Our four-hour chart shows a bullish swing that took price above the moving average, indicating an uptrend on the time frame having broken through the various resistances.
On the four-hour time frame, we can see that a correction is about to happen on the USDSGD pair. We noticed the stochastic Indicator indicates the overbought region’s price, which will attract a short position from the 1.37745 levels down to 1.3258 zones.
Bullish Scenario:
A general bullish scenario is building based on the daily time frame as the price has gained upward momentum, having closed above the neckline of 1.37545. We expect the pair to rise after a retest of the zone.
Bearish Scenario:
The weekly chart still has a bearish scenario based on the swings, and we expect the continuation of the trend as long as the correction (present bullish rally) does not become a reversal of the bearish trend.
Conclusion
Singapore’s foreign exchange is likely to lose her gain against the U.S. currency as we can see signs of the dollar having strength from the daily chart.
We expect the bullish trend to play out from the daily chart to rise to the resistance levels of 1.3920.

I've been a professional trader for over 5 years.
Currently I work as forex analyst for different investment companies.
- EURUSDWeekly outlook – 7th January 2022 - January 7, 2022
- BTCUSD – Weekly outlook for Bitcoin Price – 23rd December 2021 - December 24, 2021
- USDSGDWeekly outlook for Singapore Dollar – 17th Dec 2021 - December 17, 2021
Tagged with: usdsgd