
USDSGD Outlook and Technical Analysis for Singapore Brokers
Contents
Introduction
The currency of the Asian Tiger, Singapore, has shown strength against the USD in the midst of a US vs. China trade war, as it is generally traded on Singapore binary options broker platforms.
Let’s look into some of the exciting fundamental and technical drivers of the USD to SGD exchange rate.
Singapore Fundamentals
Retail Sales Singapore
Singapore Retail sale is a leading indicator of consumer spending and generally accounts for the significant activities of the economy.
At the retail level, it estimates the disparity in the full value of adjusted inflation sales.
The actual value came out at a shocking -2.2% compared to a forecast of -0.6% and previous of 0.4%, therefore implying a bearish outlook towards the Singapore dollar.
United States Fundamentals
CFTC S&P 500 Speculative Net Positions
It is an indicator used to gauge market sentiment, and generally followed by traders to enable the decision to enter a long or short position.
As a weekly commitment of traders report issued by the CFTC, it presents a summary of non-commercial trader positions in the United States futures market.
The actual value was release as 17.2K a value less than the previous at 53.1K.
USDSGD Technical Analysis
USDSGD: Weekly Chart

Starting from a weekly chart perspective, the USD to SGD exchange rate increased by about 2.0% before it later collapsed by an opposite 1.6% from a bearish signal on 27 May ’19 with resistance set at 1.38364.
The bullish engulfing candlestick pattern signaled on 01 July ’19 confirms a decision by the bulls to send the price into a bullish upbeat after setting support at 1.35123.
USDSGD Daily Chart

The above daily time frame gives clarity to the bearish campaign of May 30 ’19 as well as reinforce the selling pressure, following a regular bearish divergence with set resistance at 1.38364.
A break above bearish resistance on 01 July ’19 initiated a retracement of the bearish trend by 0.83%, followed by a continuation of the bearish trend on 10 July ’19 with resistance set at 1.36246.
USDSGD H4 Chart
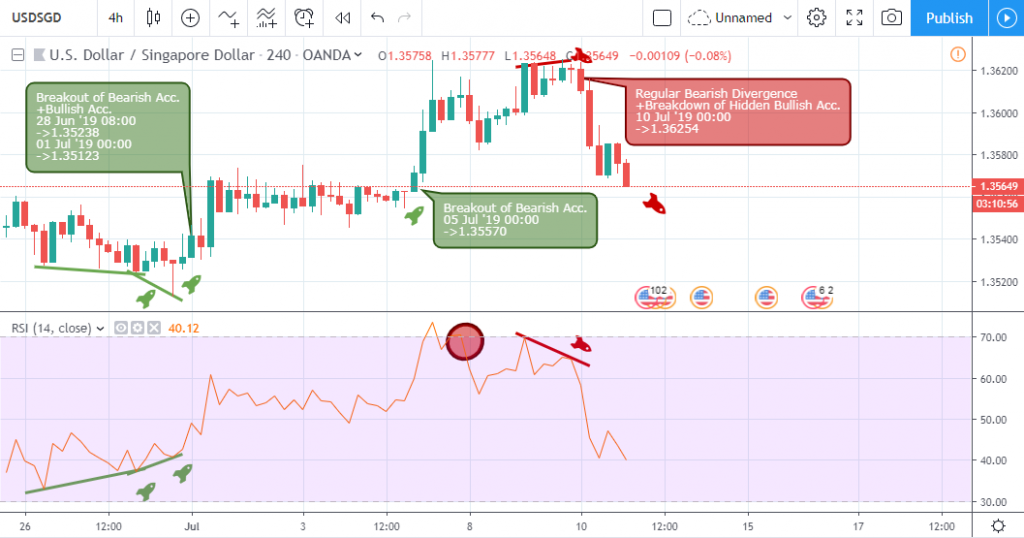
The 4hour chart shows a series of regular bullish divergence on 28 June ’19 08:00, which reinforced the breakout of bearish resistance mentioned from as viewed earlier on the daily time frame.
An increase in buying pressure fueled the rise, forcing the foreign exchange of the USDSGD into a steady bullish trend before the price entered the overbought area, followed by a regular bearish divergence setup.
After descending for about 0.48%, the anticipated fundamental events for the week, in combination with an increase in buying power on 11 July ’19 04:00 result in a huge surge in the price of the USD to SGD exchange rate.
At press time, the exchange rate resumes a bearish trend in favor of the Singapore dollar.
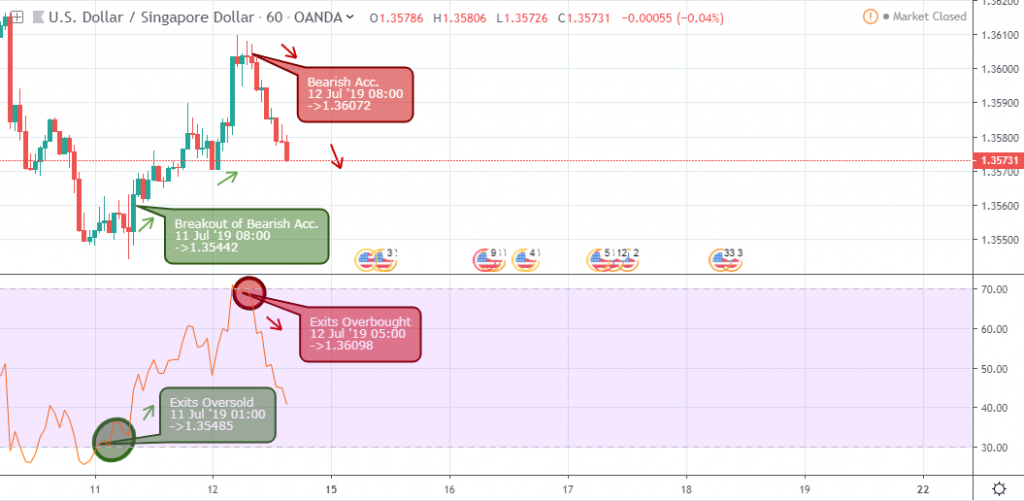
Conclusion and Projection
The Singapore dollar shows strength against the USD as the week comes to a close. An update to the 1hour chart below shows an increase the pair exiting the overbought area alongside signaling a bearish pressure candlestick pattern on 12 July ’19 08:00.

I've been a professional trader for over 5 years.
Currently I work as forex analyst for different investment companies.
- EURUSDWeekly outlook – 7th January 2022 - January 7, 2022
- BTCUSD – Weekly outlook for Bitcoin Price – 23rd December 2021 - December 24, 2021
- USDSGDWeekly outlook for Singapore Dollar – 17th Dec 2021 - December 17, 2021