
USDSGD Outlook and Technical Analysis for Singapore Brokers
Contents
Introduction
The USDSGD experienced a sudden surge in the exchange rate on IQOption trading platforms as we entered the month of October. Join us as we identify the significant macroeconomic as well as technical drivers of the USD vs. the Singdollar.
Singapore Bank Lending
Bank Lending index evaluates the difference in the total sum of outstanding bank loans given to businesses and consumers. Spending and borrowing are pointers to the level of consumer confidence.
When the reading is higher than expected, it is seen as a positive trend for the SGD. When the reading is lower than expected, it is seen as a negative trend for the SGD.
The latest release reveals that the actual reading read 684.9B while the previous value read 680.7B, pointing to a negative trend for the Singapore Dollar.
U.S. ADP Nonfarm Employment Change
The ADP National Employment Report, which is based on the payroll data of roughly 400,000 business clients in the United States, estimates the monthly variation in private-sector employment and non-farm. The data which is released two days before the release of government data is a reliable indicator of the government’s non-farm payroll report.
When the reading is higher than expected, it is seen as a positive trend for the USD. When the reading is lower than expected, it is seen as a negative trend for the USD.
The latest release reveals that actual reading to be 195K while the Forecast data read 148K. The previous value read 142K, pointing to a positive trend for the U.S. Dollar.
USDSGD Technical Analysis
USDSGD Long term Projection: Bullish
USDSGD: Weekly Chart

A combination of bearish engulfing and failure of support on September 02 initialized a correction of the bullish trend.
Upon signaling a bullish inside bar on September 16, the bulls launched a campaign that sent the price high by roughly 0.77% from the inside-bar’s closing price.
USDSGD Medium Term Projections: Bullish
USDSGD Daily Chart

A sequence of higher highs of the price compared to lower highs of the RSI oscillator signals regular bearish divergence that eventually forced the USD to SGD below the 50-period Moving Average.
The break of resistance 1.37582, sends the pair northbound in favor of the Greenback as the price trades above the MA-50.
USDSGD H4 Chart: Bullish

The 1.37203 support level established after a regular bullish divergence on September 15, from which the foreign exchange of the USDSGD continued to setup higher lows.
Opportunities to scale into the bullish trend were presented on September 24 21:00, 30 05:00, and October 01 01:00. The bullish support at 1.38026 stood the test of time and sent the price higher by about 0.4%.
USDSGD H1 Chart: Bearish to Consolidation
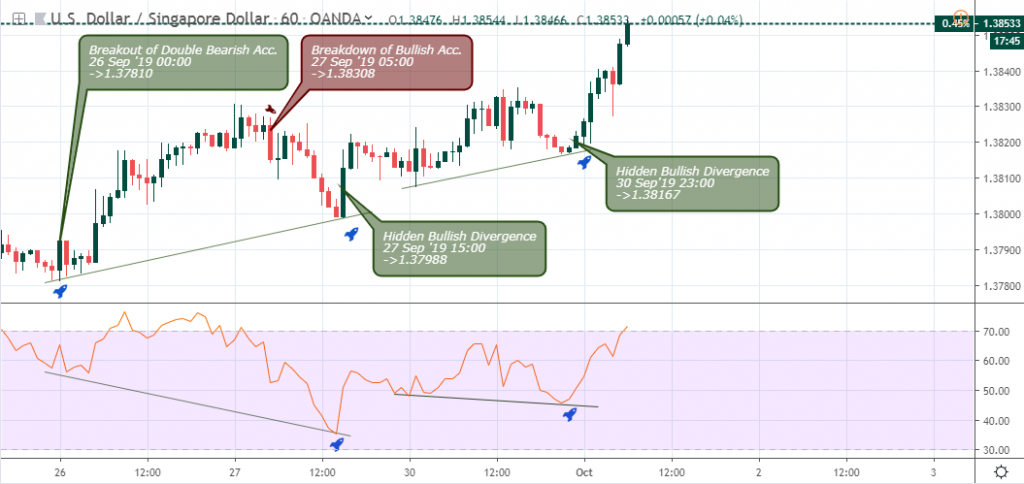
The intraday chart offers great buying signals on September 26 00:00 following a break above resistance 1.37870, followed by a sequence of hidden bullish divergence patterns on September 27 15:00 and 30 23:00 at press time.
Conclusion and Projection
The Greenback is the dominant currency here, as the analysis shows a continuation of the bullish trend. We’ll be on the lookout for reversal patterns, which are best for taking profits as the bullish trend advances further.
I've been a professional trader for over 5 years.
Currently I work as forex analyst for different investment companies.
- EURUSDWeekly outlook – 7th January 2022 - January 7, 2022
- BTCUSD – Weekly outlook for Bitcoin Price – 23rd December 2021 - December 24, 2021
- USDSGDWeekly outlook for Singapore Dollar – 17th Dec 2021 - December 17, 2021