
USDSGD Outlook and Technical Analysis for Singapore Brokers
Contents
Introduction
Last weeks’ bearish closing price shows a 1.6% increase in strength for the Singapore dollar following a combination of positive endogenous events from the Singapore economy and technical pattern that we’ll be revealing in this post.
Read on for an in-depth analysis of the USDSGD as traded on Binomo broker.
Singapore Trade Balance
The Trade Balance evaluates the change in value between goods imported and goods exported, and services offered over the reported period. A positive number shows that more export value was higher than the import value.
A reading that is higher than expected means a positive or bullish sentiment for the SGD, while a reading lower than anticipated should be considered bearish or negative for the SGD.
Data released recently for August 16 shows the actual reading to be 2.830B, while the previous value was 2.450B, implying a bearish course for the currency.
U.S. Empire State Manufacturing Index – NY
The U.S. Empire State Manufacturing Index evaluates the relative level of general business conditions in New York State. The data is compiled from a poll of roughly 200 manufacturers in the New York State.
A level above 0.0 indicates improving conditions, while any level below 0.0 indicates worsening conditions. S.D., while a lower than expected reading should be considered as negative/bearish for the USD.
A reading higher than expected means a positive or bullish sentiment for the USD, while a reading lower than anticipated should be considered bearish or negative for the USD.
Data released recently for August 15 shows the actual reading to be 4.80, while the previous value was 4.30. The forecast figure read 3.00, inferring a bullish outlook for the currency.
USDSGD Technical Analysis
USDSGD Long term Projection: Bearish
USDSGD: Weekly Chart

After breaking out of a bullish inside-bar resistance on July 22 ’19, the USD to SGD exchange rate completed a 3.15% price increase from the July 01 low to September 02 high.
Buying pressure dried up as the bears crashed beneath bullish support 1.38616 on September 02, thereby giving a boost to the foreign exchange of the Singapore dollar. A regular bearish divergence setup fueled the price decline on the same date as the price collapse.
USDSGD Medium Term Projections: Bearish
USDSGD Daily Chart

Coming one step down to the daily time frame, the bears establish a sequence of regular bearish divergence patterns on August 15 and September 03 ’19. The bearish chart patterns on the daily time frame along with the bearish candlestick pattern on the weekly time frame forced the pair to close at 1.37333 last week.
USDSGD H4 Chart: Bearish to Consolidation
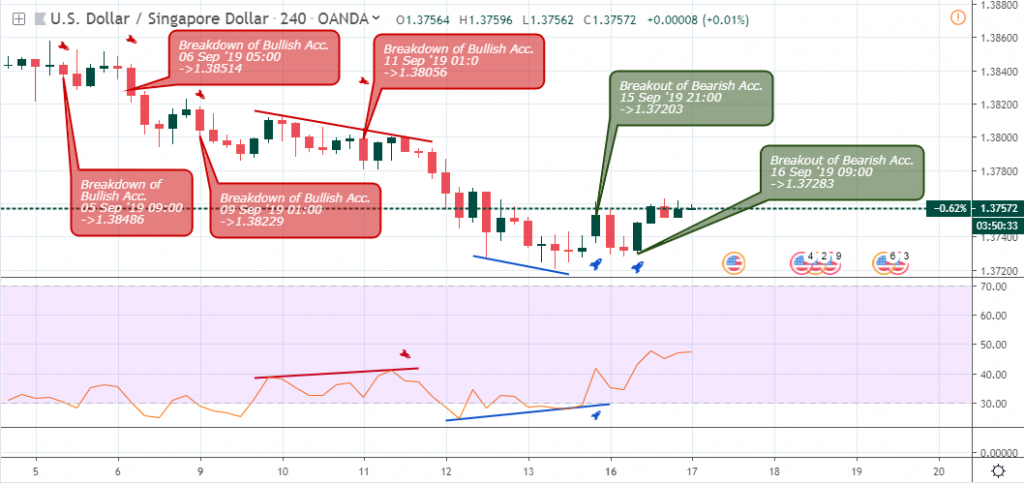
We round up with the 4hour chart also flagging an increase in selling bias from a failure of bullish support on 06 September before a bearish divergence on 11 September.
The bulls make efforts to restore the price by signaling a regular bullish divergence on September 15 and a break of resistance on September 16. Again, the bulls couldn’t sustain the price hike as sellers keep the price low.
Conclusion and Projection
Although the USD to SGD shows a stable bearish outlook that favors the Singapore dollar, a price close beyond the 1.37582 resistance from a daily chart overview may show strength for the Greenback; otherwise, the bearish trend may continue.

I've been a professional trader for over 5 years.
Currently I work as forex analyst for different investment companies.
- EURUSDWeekly outlook – 7th January 2022 - January 7, 2022
- BTCUSD – Weekly outlook for Bitcoin Price – 23rd December 2021 - December 24, 2021
- USDSGDWeekly outlook for Singapore Dollar – 17th Dec 2021 - December 17, 2021