USDSGD Outlook and Technical Analysis for Singapore Brokers
Contents
Introduction
After a bearish closing month in Q2 2019, the USDSGD exchange rate bounced off significant support established at the early period of the quarter, amidst the US/China trade war.
This week move on to identify important macroeconomic events and technical chart patterns driving the trend of the USDSGD on Binomo platform.
Singapore Manufacturing PMI
The PMI – Purchasing Managers Index anticipates the level of activity of purchasing managers in the manufacturing division.
A reading that is over 50 signifies an increase in the sector; while a reading under 50 registers a contraction.
Traders and market players observe these surveys closely as purchasing managers usually have access to firsthand data about their company’s performance. This data can be a crucial indicator of the overall performance of the economy.
A higher reading that exceeds expectations should be deemed bullish or positive for the SGD, while a lower reading below expectation should be considered adverse for the SGD.
Latest data shows that previous data to be 49.6 while the actual reading stood at 49.8, signaling a bearish trend for the SGD.
U.S. Nonfarm Payrolls
Job creation is one of the leading indicators of consumer spending, which is responsible for a significant part of economic activity. The Nonfarm Payrolls calculates the difference in the number of people employed during the preceding month, excluding data from the farming industry.
A higher than anticipated reading should be deemed bullish or positive for the dollar, while a lower than the anticipated text should be considered to be negative or bearish for the currency.
Most recent data released on August 02 shows actual and forecast readings to be 164k while the previous reading recorded 193K, indicating a bearish outlook for the USD.
USDSGD Technical Analysis
USDSGD Long term Projection: Bullish Swings
USDSGD Monthly Chart

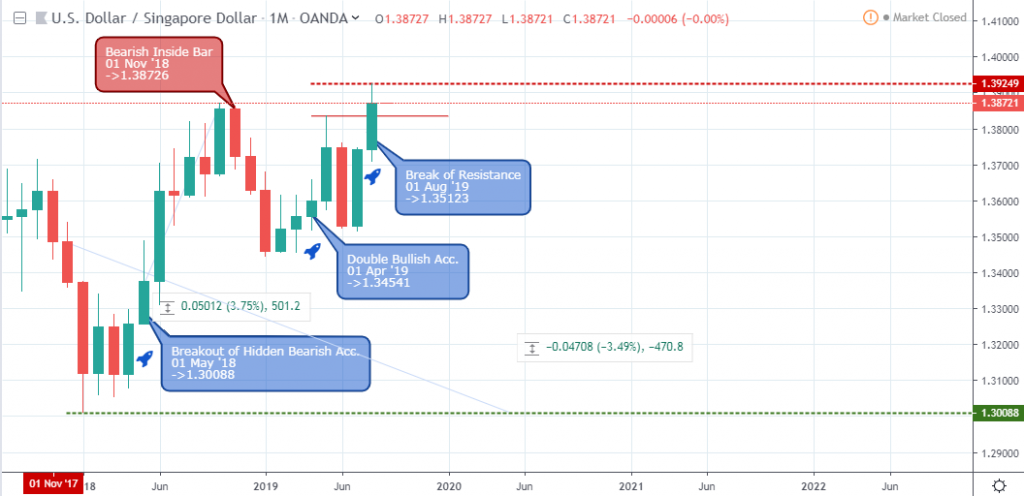
The double bullish accumulation patterns on April 01 ’19 marked an end to the price correction that started from the bearish inside bar on November 01 ’18.
As mentioned in the introduction, the accumulation of buy orders set the necessary support for the price recoil seen in August, which led to a price break above resistance.
With the USD to SGD price in a parabolic motion, we anticipate a further increase in the foreign exchange.
USDSGD: Weekly Chart

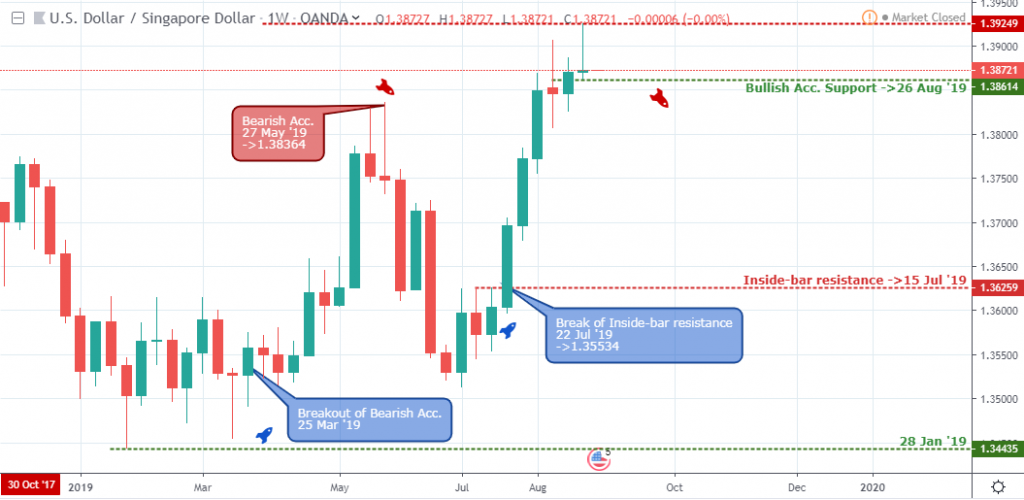
Last week closed bullish and triggered an increase in buy orders that led to a rapid price surge at the opening of the trading week on September 02.
The consecutive bullish closing bars were confirmed by a breakout above bearish inside bar resistance earlier on July 22 ’19 after a price decline from the bearish pattern on May 27 ’19.
USDSGD Medium Term Projections:
At the mid-term time frames, we identify the underlying price patterns of the weekly charts consecutive bullish closing bars.
USDSGD Daily Chart

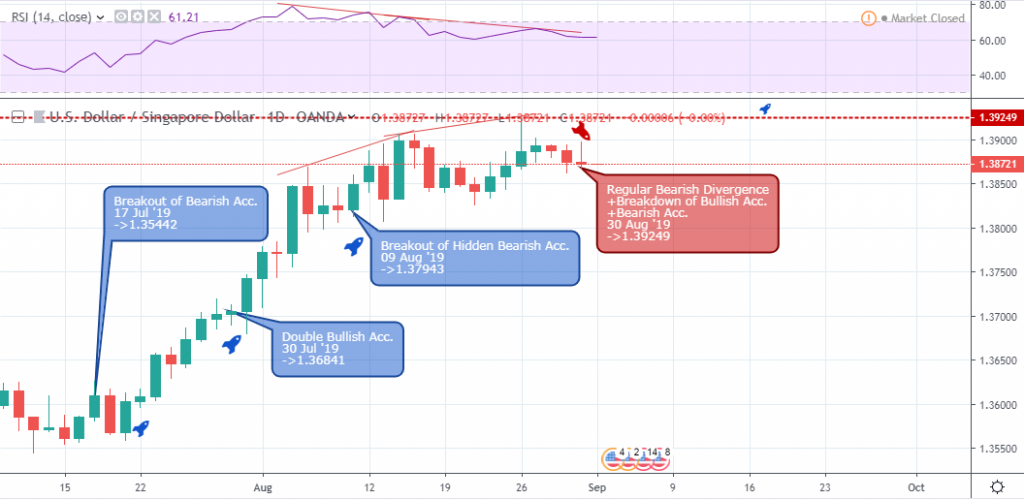
An increase in buying power on July 17 ’19 set the pace for the bullish upbeat. The accumulation of buyers on July 30 ’19 drove the price of the USD to SGD higher, for about 1.7% into this week.
A sequence of regular bearish divergence patterns signal early take-profit levels and a probable sell order into a downward trend. The price hike this week show the resilience on the part of the bulls. If the price close above the 1.39249 resistance, we should expect a strong continuation of the bullish trend, otherwise the price may switch to a bearish trend.
USDSGD H4 Chart
A quick hint of bullish presence is the break of resistance on August 29 ’19 16:00. This price setup confirms an end to a price correction that started from an earlier price break on August 21 ’19 12:00.
The USD appreciated by an extra 0.4% against the Singapore dollar earlier this week. At publication time a failure of bullish support 1.39238 on September 03 04:00 reveals a bearish outlook for the USDSGD as the daily time frame came out of the overbought area on August 16 ’19.
Conclusion and Projection
The current state of the USDSGD price chart is not suitable for entering into long term positions as the pair is overbought on the daily time frames. It is, however, ideal to take profits from earlier long positions considering the bearish divergence patterns on the daily time frame.
If you must enter a long position, it must be entered with a sniper mentality and exit as soon as possible. We expect a bearish price correction from the early rally at the beginning of this week.

- EURUSDWeekly outlook – 7th January 2022 - January 7, 2022
- BTCUSD – Weekly outlook for Bitcoin Price – 23rd December 2021 - December 24, 2021
- USDSGDWeekly outlook for Singapore Dollar – 17th Dec 2021 - December 17, 2021

