
USD/SGD Weekly Analysis for IQ option Singapore
Contents
Introduction
There’s no signs yet of a possible recovery of the Singapore economy as the currency still suffer a loss when paired against the United States dollar, not to mention the Singapore 30 being in a strong bearish trend. Read on as we take a look at both technical and important fundamentals that drive the price of the pair.
U.S – China Trade War may have negative impact on Singapore Economy
According to the Monetary Authority of Singapore, the tariffs imposed by Washington, in the amount of $250 billion of Chinese goods, though it has not yet started having a negative impact on the Singapore economy at the moment, the aftermath could have a huge negative impact moving forward.
Singapore 30 [SG30SGD]

From the above daily chart analysis, Singapore 30 showed how the pair broke out of a bearish accumulation pattern on September 12 and later failed to a combination of bearish accumulation and breakdown of bullish accumulation patterns. This chart summarizes the health of the 30 companies in this basket and they are currently in a bearish trend.
The U.S Dollar Currency Index [DXY]
The U.S Dollar index which is a measure of the USD against 6 major pairs dipped for about 30% after making an approximate rise on the daily chart, following a bearish regular divergence on the 2hr timeframe. Though the DXY has closed bearish as shown on the above chart, the overall trend is bullish which further highlights the strength of the dollar against the Singdollar.
Technical
USDSGD: Monthly Chart
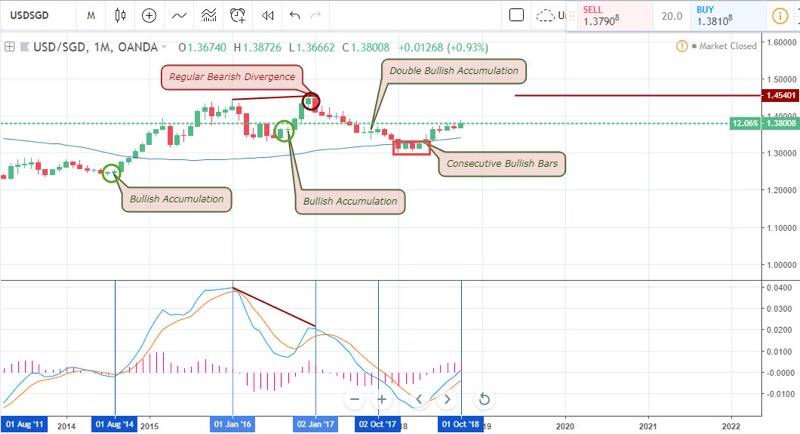
Looking at the monthly chart of the USDSGD currency pair above, we’ll notice that the pair maintains a bullish outlook. Despite a few bearish closing bars, the pair remains in a series of consecutive bullish closing candles, indicating strength on the part of the dollar and weakness of the Singdollar. Again, the MACD(9,21,5) maintains the golden cross, still in support of a bullish direction, and though the cross is coming from below the zero level of the MACD, the oscillator is gradually moving towards the zero level.
USDSGD: Weekly Chart
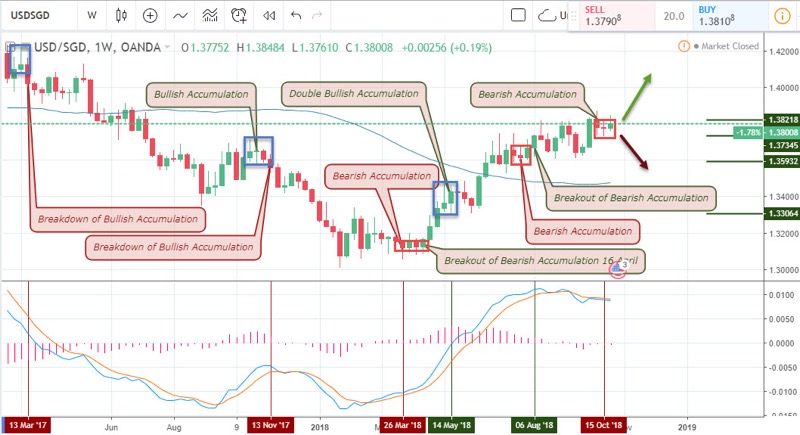
Similar to previous reviews we’ve done, the weekly chart shows the failure of bearish accumulation patterns, along with bullish accumulation patterns that support the bullish trend starting from 26th March to current date 15th March. As the trend builds up, all attempts for bears to turn the tide was futile. An instance is the breakout of bearish accumulation on August 06.
On the 15th of October, price signalled a recent bearish accumulation pattern which is believed to fail to a breakout considering the antecedence of the bearish accumulation patterns. On the other hand, following our idea of trading this strategy, we’ll only take a short position with a very low risk considering that bearish is the current pattern at play. A close above the 1.38218 resistance price of the bearish accumulation pattern signals a continuation of the bullish trend.
USDSGD: Daily Timeframe
Best for swing trading is the daily chart as sellers fail to move price lower through bearish accumulation patterns. After signalling a bearish accumulation pattern on August 02, there followed a breakout of the accumulation on the pattern, which was even preceded by a bullish accumulation pattern.
On the 29th of August, price triggered another bullish accumulation pattern leading to a confluence of events with a bullish hidden divergence pattern, causing an upward surge in the exchange rate of the USD to SGD. At the moment of putting this review together, price formed a bullish accumulation pattern with huge potentials of a bullish trend continuation.
USDSGD: 4-HOURLY Timeframe
The 4hour chart is my prefered time frame for binary options trading. Between the 4th and 9th of October price fired a double bearish regular divergence pattern which sends price tumbling down as shown on the above chart 0.75% compared to a 0.3% risk exposure. As the bearish trend winds down to a halt on the 17th of October, a bullish regular divergence pattern was fired, sending price upwards. October 24, a more recent breakdown of a bullish accumualtion pattern was triggered.
USDSGD: 2-Hour Chart
Starting from 15th October, price broke out of a bearish accumulation pattern, leading to a similar upward move as the 4-hour chart. The bullish trend ended by an opposite breakdown of bullish accumulation pattern, as well as a dead cross of the MACD oscillator. On October 22, another breakout of bearish accumulation sends price back up to the former high of the 19th, forming a double top pattern. As buyers try to take the price further, up beyond the resistance level, the double top pattern was confirmed by a bearish breakdown.
Price kept on moving in a cyclic motion with series of bullish breakdown and breakouts of bearish and bullish accumulation patterns respectively. The 25th of the month of October was the last and most recent breakdown pattern and price is currently in a swing low.
Conclusion
As the week comes to an end and a new week starts, the daily chart and 4-hour chart gives a better picture of how the new week will play out. The bullish accumulation pattern on the daily chart leaves a support at 1.37872, of which a close below this level signals a bearish breakdown. For as long as price does not close below this support, we intend to enter with a 1:2 risk to reward ratio as we enter an instant buy order at the current price with a stop loss at 1.37738 and take profit at 1.38732.
On the other hand, should price close below the support level, this brings our stop loss to 1.38542 and 1st take profit target of 1.37307.
Are you a binary options trade and resident in Singapore, check out the broker section of our website for a list of Singapore binary options brokers.
Our Recommended Binary Options Broker to trade USD/SGD : IQ Option Singapore
Best Regulated Broker: IQ Option

IQ Option is the world’s leading EU regulated financial broker based with a revolutionary platform for all traders. Very popular for crypto and USD/SGD trading. Read IQ Option Singapore review
- Best Trading App for Binary Options
- Minimum Deposit of only $10
- Minimum Trade of $1
- Trusted Broker
- $10,000 Virtual Funds ( Demo Account )
- Quick Withdrawals
- Outstanding Platform
- Weekly Tournaments
- Gain up to 98%*
DISCLAIMER

I've been a professional trader for over 5 years.
Currently I work as forex analyst for different investment companies.
- EURUSDWeekly outlook – 7th January 2022 - January 7, 2022
- BTCUSD – Weekly outlook for Bitcoin Price – 23rd December 2021 - December 24, 2021
- USDSGDWeekly outlook for Singapore Dollar – 17th Dec 2021 - December 17, 2021