
USD/SGD Technical Analysis for Singapore binary options
Contents
Introduction
The Singapore dollar starts to show strength against the US dollar after a bullish trend that started last year May ’18. The pair currently hangs by a thread as it rests on a moving average from the higher monthly time frame. Join us this week to get our opinion on the critical fundamental and technical patterns that decide the price direction.
Singapore Consumer Price Index
This index released on Monday by the statistics Singapore is often used to gauge inflation as it shows the cost of procuring goods and services by average consumers.
Singapore Industrial Production
The Department of Statistics in Singapore released the readings of the industrial production index this week Tuesday. This reflects variations in the volume of physical output of Singapore’s mines, factories, and utilities.
Growth in industrial production indicates a growth in the economy and consequently the growth of the Singapore dollar.
United States Retail Sales
The US Census Bureau release figures based on the total measured receipts of retail stores. Through changes in these figures, speculators and trades are able to project consumer spending.
Greater actual values are regarded as positive for the Singapore dollar, while a low reading leads to a bearish foreign exchange.
Technical
USDSGD: Monthly Chart

As the month comes to a close, the USDSGD, starts a bearish decline on lower time frames, thereby leaving the monthly chart with a high upper wick. At this point, a trend reversal is not yet confirmed and the bearish trend is still intact, despite the moving average acting as support at 1.3462.
USDSGD: Weekly Chart
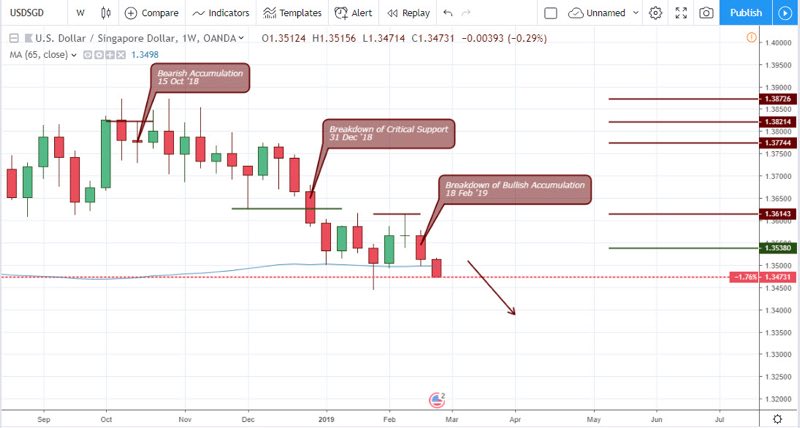
The above weekly chart confirms a continuation of the bearish trend initiated by a bearish accumulation on 15 October ’18, by signaling a more recent breakdown of bullish pressure on 18 February ’19. This sets a strong resistance at 1.36143, as price threatens to close beyond the moving average.
USDSGD: Daily Timeframe
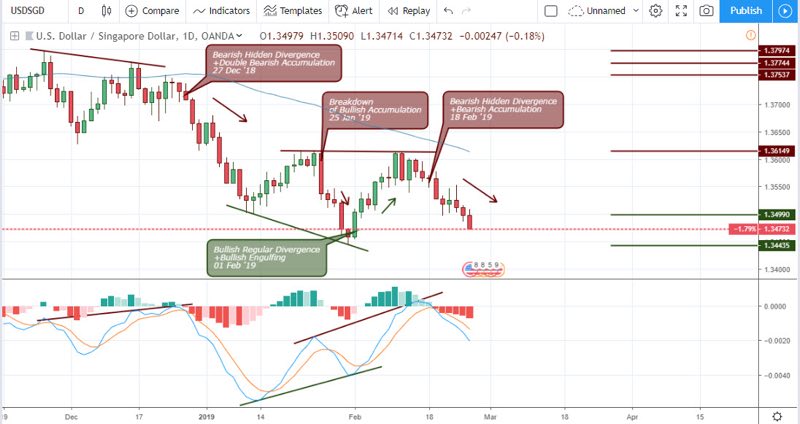
On 27 Dec ’18, a hidden bearish divergence is confirmed by a double bearish accumulation, resulting in a 1.43% price decline. The pair later enters into an alternating bullish and bearish divergence oscillatory cycles, with a hidden bearish divergence confirming a bearish decline on 18 February ’19.
4-HR Chart of the USDSGD
The 4hour chart started off by triggering a series of failure of bearish pressure points, starting from 31 January ’19, to 06 February and 08 February ’19. A bearish trend was initiated from a dark cloud cover formation on 11 February ’19 22:00. A bearish accumulation pattern confirmed the failure of the moving average on 19 February ’19 10:00 as price plummets by 0.47%. A more recent failure of bullish pressure on 26 February established resistance at 1.35090.
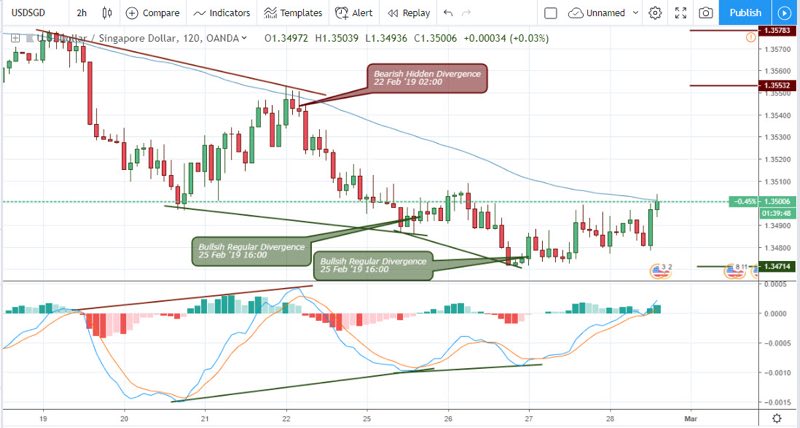
2-HR Chart of the USDSGD
After a breakdown of bullish pressure on 19 February ’19 08:00, price entered into a steep bearish trend and later transitions into a hidden bearish divergence on 22 February. Just like on the 4hour time frame, a failure of double bullish accumulation was triggered on 26 February ’19 08:00.
Conclusion
Prior to publishing this article, we observed a build-up of regular bullish divergence patterns on 25 February, which indicates possible recovery of the US dollar. In conclusion, this may indicate the relevance of the MA-65 of the monthly chart and a possible start of a bullish trend. You may like to read our reviews on different Singapore binary options platforms to initiate your trades.

I've been a professional trader for over 5 years.
Currently I work as forex analyst for different investment companies.
- EURUSDWeekly outlook – 7th January 2022 - January 7, 2022
- BTCUSD – Weekly outlook for Bitcoin Price – 23rd December 2021 - December 24, 2021
- USDSGDWeekly outlook for Singapore Dollar – 17th Dec 2021 - December 17, 2021
Tagged with: usdsgd