
USDSGD Technical Analysis for Singapore binary options
Contents
Introduction
In the past three months, the Singapore dollar has been showing strength over the USD. This week we take a look at critical price patterns that hint on a possible switch in trend direction from bearish to bullish. First, we look at a few fundamental announcements that may likely justify this move.
Consumer Price Index (CPI)
Statistics Singapore, on Monday, March 25 ’19, released the nations CPI which is a measure of price rate of change in goods and services bought by families, estimating the average level of a given time period. It is generally used to gauge the level of inflation in a nation.
Chicago Purchasing Managers’ Index (PMI)
The Chicago PMI is scheduled for release by the ISM-Chicago on Friday, March 29 ‘19. It aggregates the health of businesses within Michigan, Indiana, and Illinois. The PMI offers a pointer to trends in businesses and generally used as an indicator of economic health in the U.S. Readings greater than 50 shows a growth in the U.S economy while results less than 50 shows a bearish USD.
Technical
USDSGD: Monthly Chart

The monthly chart of the Singapore Dollar paired against the US Dollar shows bullish and bearish swings in the form of a sequence of consecutive bearish (01 November ’17 to 01 January ‘18) and bullish (02 April ’18 and 01 October ‘18 ) closing candles. A closer zoom to the weekly chart will show timely entry points into the bearish trend.
USDSGD: Weekly Chart

Starting with a regular bearish divergence on 15 October 2018, the pair resumed a bearish trend that lasts for about 21 weeks and 3.29%. Price broke below critical support of 1.36270, which later moved price into a congestion zone, followed by a failure of bullish accumulation on 18 Feb ’19.
Check out a more current update at the conclusion section of this post.
USDSGD: Daily Timeframe

An accumulation of sellers can be seen through the double bearish pressure initiated on 26 and 27 December ’18 for a 1.5% price decline from the pattern. The pair from that point on transitioned into an expanding channel pattern, formed by alternating bullish and bearish divergence on 01 February ’19 and 18 February ’19.
A more recent regular bullish divergence pattern is anticipated on 21 February ’19. These divergence patterns also resulted in consecutive bullish and bearish closing bars with better entry signals formed on the 4hour chart.
4-HR Chart of the USDSGD
On 08 March ’19 02:00, the pair triggers a collapse of bullish accumulation, which was immediately followed by a bearish accumulation pattern at 6 AM. Upon breaking below a critical support level on 11 March ’19 17:00, the Singapore dollar experienced a rapid increase in strength that led to a subsequent collapse of bullish pressure on 13 March ’19 13:00.
The bears later gathered on 14 March ’19 17:00 – 21:00, fueling the strength of the Singapore dollar by 0.74%.
Upon a failure of the bearish accumulation resistance (1.34702), the anticipated bullish divergence on the daily time frame was confirmed leading to a 0.42% increase.in the greenback.
2-HR Chart of the USDSGD
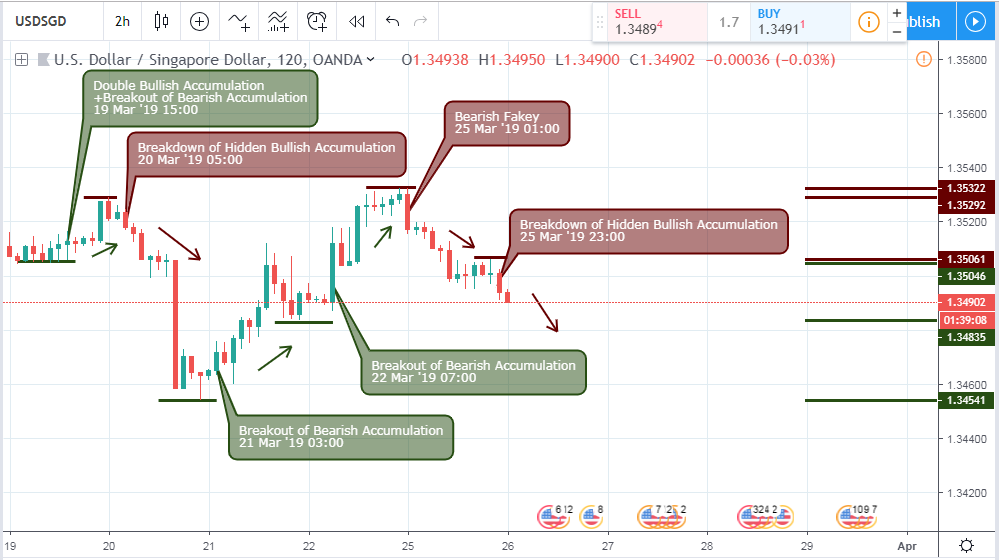
Great for taking trades off of IQOption.com , a major binary option broker, is the 2hour time frame, as it offers low trade holding periods. Similar to the 4hour chart, the pair also breaks out of bearish accumulation on 21 March ’19 03:00. Although a bearish fakey pattern indicated a bearish trend on 25 March ’19 01:00, the pair later resumed a bullish trend breaking the critical resistance levels shown above.
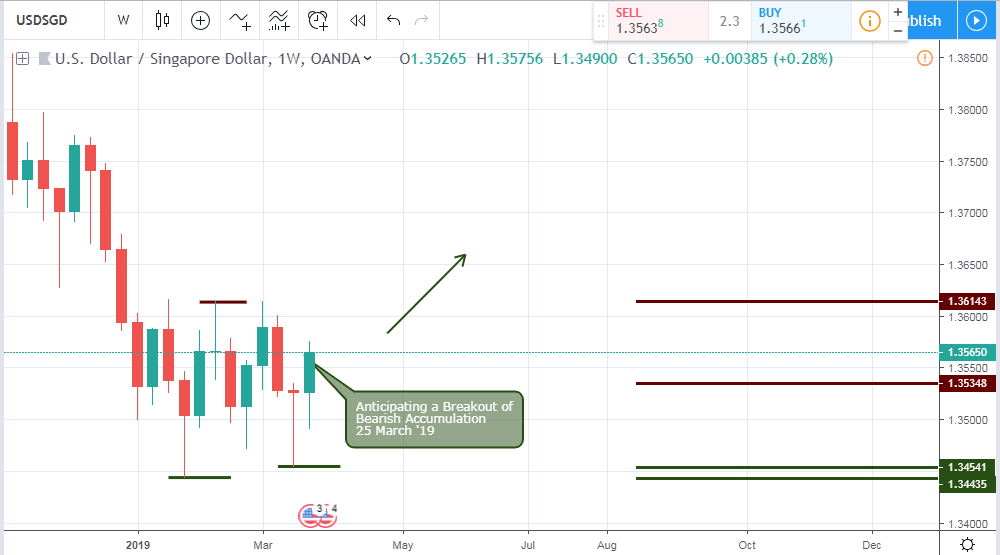
Conclusion
Going forward, the earlier analyzed weekly time frame at press time threatens a breakout of bullish accumulation as this week currently trades above the bearish accumulation resistance of 1.35348. By this we see the Singapore dollar giving way to the US dollar.

I've been a professional trader for over 5 years.
Currently I work as forex analyst for different investment companies.
- EURUSDWeekly outlook – 7th January 2022 - January 7, 2022
- BTCUSD – Weekly outlook for Bitcoin Price – 23rd December 2021 - December 24, 2021
- USDSGDWeekly outlook for Singapore Dollar – 17th Dec 2021 - December 17, 2021