
USDSGD weekly outlook: USDSGD headed to test the resistance level at 1.33106
Contents
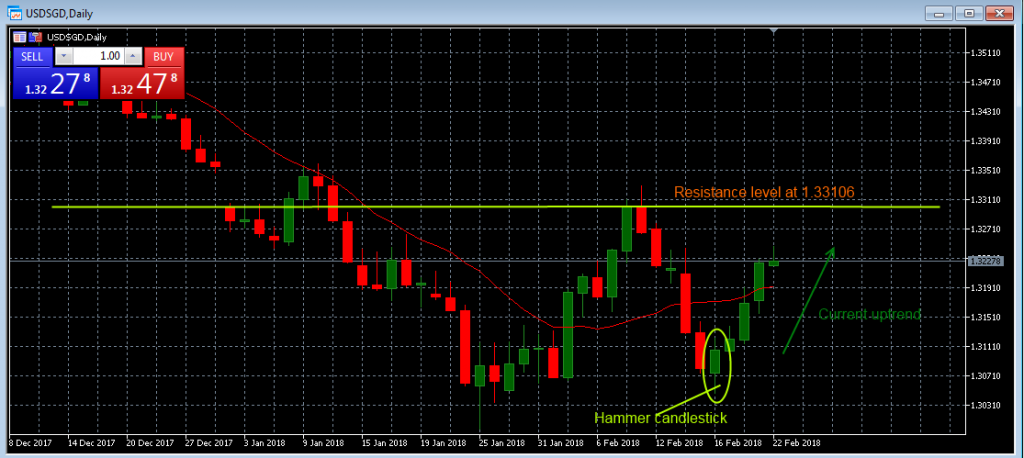
Last week saw the USDSGD plunge to below 1.3. The downtrend which was reflected on almost every Singapore binary options broker was a week-long starting from 9th to 16th.
However, after the formation of the hammer candlestick on 16th, the prices took a turn and assumed a bullish trend which they have maintained for the five days consecutively.
For those who noticed the hammer candle formation, they were lucky to close their sell orders if any since the prices are headed to the resistance at 1.33106, which the prices hit before heading down to the previous’ week downtrend.

Hammer candlestick: Always the formation of a hammer indicates a probable price reversal. At such times you close all open orders which are in relation to the trend you were following. And wait to confirm if the trend is really reversing.
Using Moving average
From the look on the Daily chart above, it is evident that the prices took quite a long while to cross the Moving average but the 21st candlestick eventually crossed the MA. This confirms that the uptrend is a strong one and traders can now confidently place buy orders.
However, for them be certain of what to expect, let’s go ahead and give a full analysis of the market according to what most Singapore binary options brokers are providing on their trading platforms.
Using the Fibonacci levels and triangle pattern
From a look at things according to a number of Singapore brokers, the USDSGD prices seem to be on a bullish trend. However, there is fear that the prices may retrace after hitting the resistance level at 1.33106.
Actually, it is just a matter of time from the way the market prices are behaving before we find out the truth!
Looking at the Fibonacci levels, it is evident that the prices are already past the 61.8% retracement level of the last downward movement. This tells you that the probability of hitting the 100% level are very high.
But what next after hitting the 100% retracement level where the resistance is?
Luckily enough, you can identify a descending triangle pattern. The tringle pattern can prove to be very helpful in determining whether the prices will move on or not.
If the prices breakout at the upper trend line of the tringle, then traders should be certain that the prices could go beyond the resistance level at 1.33106.
Monthly Chart
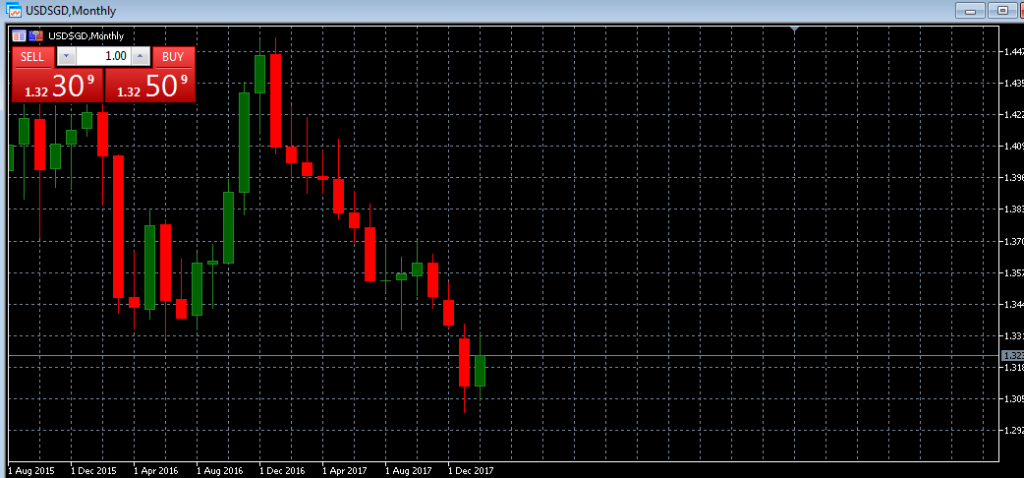
And if this happens, then the USDSGD pair may be reversing the long-term downward trend that has been reflecting on every Singapore broker platform, which started on January 2017. So, just be ready.
Our Recommended Singapore binary options Broker USDSGD:
Best Regulated Broker: IQ Option

IQ Option is the world’s leading EU regulated financial broker based with a revolutionary platform for all traders. Very popular for binary options & crypto trading. Read IQ Option review
- Best Trading App for Binary Options
- Minimum Deposit of only $10
- Minimum Trade of $1
- Trusted Broker
- $10,000 Virtual Funds ( Demo Account )
- Quick Withdrawals
- Outstanding Platform
- Weekly Tournaments
- Gain up to 98%*
DISCLAIMER

I've been a professional trader for over 5 years.
Currently I work as forex analyst for different investment companies.
- EURUSDWeekly outlook – 7th January 2022 - January 7, 2022
- BTCUSD – Weekly outlook for Bitcoin Price – 23rd December 2021 - December 24, 2021
- USDSGDWeekly outlook for Singapore Dollar – 17th Dec 2021 - December 17, 2021