
USDSGD Technical Analysis for binary options
Contents
Introduction
The Singapore market is starting the week with a national holiday to resume activities on Tuesday.
The Singapore foreign exchange had a good month against the U.S. dollar as of the result of the U.S. crisis at the close of July 2020.
We shall look at the chart to know where the possible zones that will attract Singapore brokers.
Singapore Fundamentals
The Singapore banks are weighing their asset quality in the upcoming results of the second quarter.
SMEs that had collected loads of loans from banks before the outbreak of the COVID-19 pandemic will have potential default due to the lockdowns and close of businesses around the globe.
The battle against the coronavirus pandemic has led Singapore’s economy into a deep recession.
Singapore credit rating was set at Aaa with a stable outlook by Moody’s credit rating. The Standard and poor’s credit rating for Singapore is AAA, a stable outlook.
This data of rating is used by pension funds, sovereign wealth funds, and other investors to guide the country’s creditworthiness and borrowing costs.
U.S. Fundamentals
The White House and the Democrats have not agreed on specific terms regarding the pandemic stimulus package.
Amid the crisis, we can see that the dollar has been weak across all boards for weeks due to the high numbers of coronavirus infections, failure to agree over the additional stimulus during these second waves, and the decline in the treasury yields.
We expect some reports to be released this week on some indicators like CPI (Consumer Price Index). Initial jobless claims to know if there is a reduction in the number of individuals who applied compared to the previous week.
We shall be focusing on the CPI m/m news forecast.
The forecast is 0.3%, while the previous is 0.6%.
The outcome of the data measures the change of price in goods and services purchased by the consumers over time, leading to policymakers’ inflation containment measures.
If the actual result is higher than the forecast, it is suitable for the U.S. dollar, but if the reality is less than the estimates, it is a bearish move for the U.S. dollar.
USDSGD Technical Analysis
USDSGD Long term Outlook: Bullish
Monthly Chart

Monthly Resistance Levels: 1.46470, 1.41078
Monthly Support Levels: 1.30088, 1.34435, 1.3670
The initial divergence on the stochastic indicator has shown us that the USDSGD pair will be trending down in weeks to come having closed below the bullish accumulation support level.
July 2020 closed with a bright bearish candle, indicating that the bears are hoping to take down the price to the levels of 1.36700 and 1.34435.
The Bulls will have to wait for the price to get to the demand level of January and March 2018 for a robust bullish surge.
Weekly Chart

Weekly Resistance Levels: 1.39350, 1.38040
Weekly Support Levels: 1.34450, 1.35259
Our weekly time frame shows full dominance of the Bears from the resistance zone of 1.146486 down to the current level of 1.38040.
In weeks to come, we may see the USDSGD surge to the low of December 2019, having close below the support level of 1.39350 of 08 June 2020.
The Bulls may succeed in reviving their trend from the support of 1.34450 and 1.35259, respectively, if they manage to build a bullish momentum at the level.
USDSGD Medium Term Outlook: Bullish
Daily Chart

Daily Resistance Levels: 1.46463, 1.43296, 1.42688, 1.39180, 1.38240
Daily Support Levels: 1.36701
On the daily time frame, it’s obvious the bearish trend has successfully taking out the support levels on the USDSGD pair and pushing the price lower than previous lows of 1.41234, 1.39180, and 1.38742.
Will the new support zone succeed to push back the bears by closing above the resistance zone of 23 July 2020 (1.38240) to expose the 22 June 2020 (1.39937) resistance level.
H4 Chart time frame:
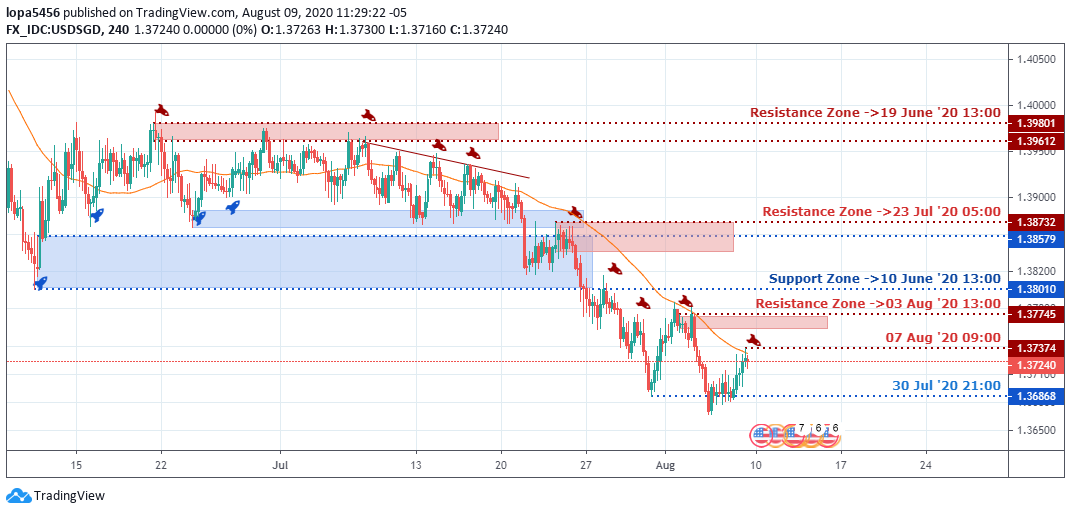
4Hour Resistance Levels: 1.39801, 1.39612, 1.37745, 1.37374
4Hour Support Levels: 1.36868
On the H4 time frame, the Singapore brokers can see that the previous psychology zone for support of 1.38010 has been taking out, and it is acting as resistance as the price is retesting the area.
The general sentiment is bearish on the H4 time frame with little resistance from the bulls.
Bullish Scenario:
On the H4 time frame, the bullish scenario is building up, and we may see the bulls surge above the recent resistance on the H4 time frame.
Bearish Scenario:
Generally, the USDSGD pair has been bearish from the weekly time frame after rejecting the bulls’ advancement from the 1.46466 resistance level. We expect the trend to continue to be bearish until the U.S. fundamental news comes with a better outcome.
Conclusion
The second wave and the effects of the COVID-19 pandemic are not favorable to the U.S. economy and better controlled by the Asian government than some U.S. government, which led to the unprecedented rise of infected cases.
The Donald Trump administration and the democrats need to find a way to agree on the additional stimulus package so that the U.S. currency will find support to bounce back from the downfall.

I've been a professional trader for over 5 years.
Currently I work as forex analyst for different investment companies.
- EURUSDWeekly outlook – 7th January 2022 - January 7, 2022
- BTCUSD – Weekly outlook for Bitcoin Price – 23rd December 2021 - December 24, 2021
- USDSGDWeekly outlook for Singapore Dollar – 17th Dec 2021 - December 17, 2021