
USDSGD Technical Analysis for Singapore
Contents
Introduction
News about the coronavirus treatments from the USA and Russia will be a successful vaccine for humankind’s benefits. IQ Option investors pay attention to the developments and how it impacts the USDSGD pair.
Let’s take to charts following a top-down analysis.
Singapore Fundamentals
Singapore’s core consumer price
Singapore’s core consumer price for July did not come out as expected.
For the past ten years, the Singapore consumer price has not dropped by 0.4% as it recently did. The consumer price outcome came out by 0.4%, which is lower than the expected result of a 0.3% monthly decline after June’s flat reading.
U.S. Fundamentals
Core PCE Price Index m/m
From the Bureau of Economic Analysis reports, it measures how consumer’s behaviour changes towards the price of goods and services they purchased without including energy services or products and foods also.
If the actual is higher than the forecasted data, the released report is excellent or bullish for the U.S. dollar, but if the outcome is lower than the predicted, it means that the U.S. dollar will be bearish.
The forecast data is 0.5%, while the previous data released was 0.2%.
USDSGD Technical Analysis
USDSGD Long term Outlook: Bearish
Monthly Chart

Monthly Resistance Levels: 1.41078 and 1.46470.
Monthly Support Levels: 1.34435, 1.38032, 1.32854, 1.30088.
The bearish divergence on the stochastic oscillator indicator has been playing out since the price closed below the bullish accumulation support level of 1.41078, pushing USDINR pair lower towards the support zone of 1.36700 a double bottom pattern.
As we wait for the price to get to that level of support, the Singapore foreign exchange has gained favorably against the U.S. dollar in the past months.
Looking at the chart, will the bearish bias continue below the 1.32854 levels, or are we going to see a bullish surge from the zone? As the months unfold, we shall get the right answers.
Weekly Chart

Weekly Resistance Levels: 1.45674, 1.46466, 1.41865, 1.43292,
Weekly Support Levels: 1.35259, 1.34450, 1.38040, 1.39350
The early part of the year 2020 started as an uptrend after the Bulls established support at levels 1.34450 and 1.35259 to take the bulls run to the resistance levels of 1.46466 before the Bears took control.
Amid the COVID-19 pandemic, Singapore’s foreign exchange was building strong momentum against the U.S. dollar when the fiat market was not stable, and global businesses were affected.
Bears were able to push back the USDSGD price down to the current level of 1.37873, having closed below the 1.38040 resistance zone.
As we start a new week, can last week bullish Doji candle bring in the bulls to rally USDINR pair up, or are we continuing with the downward trend?
USDSGD Medium Term Outlook: Bearish
Daily Chart

Daily Resistance Levels: 1.43296, 1.38240, 1.42688, 1.41234, 1.39937
Daily Support Levels: 1.38742, 1.39180, 1.36133, 1.37151, 1.41234
You can see the daily chart swing to the downside of the market as the bears keep closing below the supports, and those zones become resistances.
The outcome of the U.S. trade war against China and other internal issues among the U.S. Senators about COVID-19 relief stimulus has not helped the U.S. currency to regain its strength in the market.
At the support zone of 1.37151(19th August 2020), we can see that the bulls are trying to push back the USDINR pair up to the 1.38240 level after they found support. If they should succeed in the rally, we may see a further push to 1.39937 levels.
However, if the bulls fail, the bears will continue the bearish trend lower than the level of 1.3715 in days to come.
H4 Chart
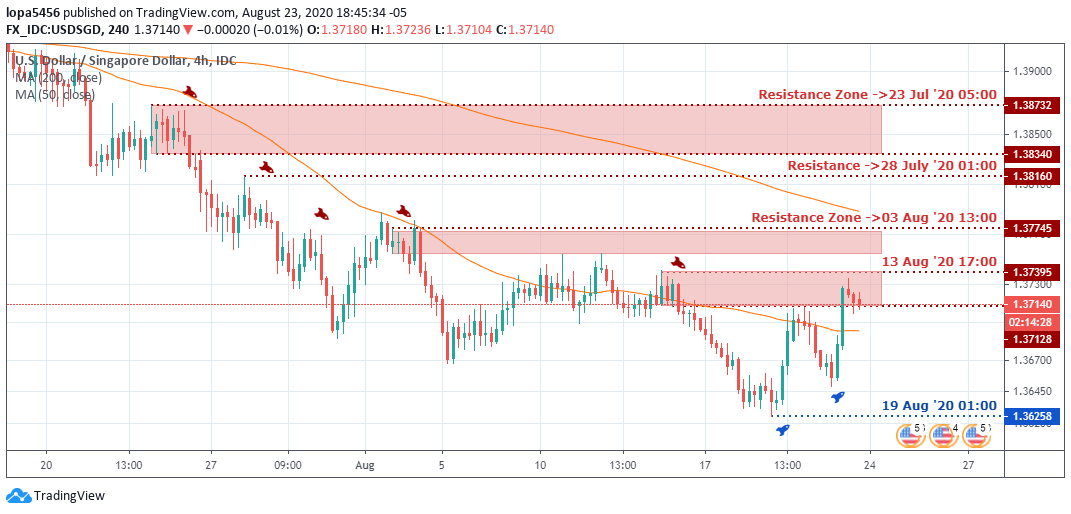
4Hour Resistance: 1.39612, 1.39801, 1.38340, 1.38160, 1.377455, 1.37395
4Hour Support: 1.39063, 1.38931, 1.38579, 1.38010, 1.38680, 1.38855
The Bears momentum is fading from this last part of the chart at the time of the report. You can see that the bear’s swing was covered by the bulls retesting the resistance levels.
A failure swing pattern is building upon the four-hour time frame, and we need to see the bulls surge close above the resistance of 1.37395 to allow more buyers to push the price higher.
From Dow Charles theory, a higher top above the previous high and a higher low above the previous low have set the trend into an uptrend. Therefore, we expect this H4 chart pattern to playout for the bulls to control the market. Bullish Scenario:
A possible bullish scenario is setting out on the four-hour time frame as we look out for the Dow Theory to play out. A closed above the resistance level of 1.37395 will attract more buyers into the market.
Bearish Scenario:
For some days and weeks, the USDSGD pair has been on a downtrend, having broken below the critical support level of 1.38240 on the daily time frame. If the level should reject the bulls’ advancement at that level.
Conclusion
The recurrences of the COVID-19 infected cases are also on the rise in Singapore as it was in the USA. The second wave of the pandemic should be taken seriously by the government to avoid another shutdown of businesses, which can affect the Singapore foreign exchange and the global economy’s recovery process.

I've been a professional trader for over 5 years.
Currently I work as forex analyst for different investment companies.
- EURUSDWeekly outlook – 7th January 2022 - January 7, 2022
- BTCUSD – Weekly outlook for Bitcoin Price – 23rd December 2021 - December 24, 2021
- USDSGDWeekly outlook for Singapore Dollar – 17th Dec 2021 - December 17, 2021
Tagged with: usdsgd