
USDSGD Technical Analysis for binary options
Contents
Introduction
IQ Option traders have had trending trades in the last four weeks of the market. As July comes to a close, we can hope for a favourable outcome in August amid uncertainty because of the second waves of the COVID-19.
Singapore Fundamentals
Singapore’s foreign exchange has been in a good state ever since the US dollar weakened some weeks back. The Singapore private home price rose for the first time amid the coronavirus at the end of Q2 by 0.3% with a reading of 1.1%.
For the non-landed properties, it rose by 0.4% compared to the Q1 fall of 1% while the landed property result was seen flat and a 0.9% Q1 fall.
U.S. Fundamentals
ISM NON-MANUFACTURING PMI: Forecast 55.0 while the previous is 57.1
As the USA economy goes through a recovery process, we see how the dollar struggles after the early rise of the currency before the sudden waves of another COVID-19 pandemic in some States of America. The number of affected cases rose sharply when the hospitals were overwhelmed with the increased patients.
It excludes the Manufacturing industries from the survey carried out by purchasing managers. This data is an economy leading indicator showing the health of the businesses in the system and how respondents’ rates of companies, employment, prices, supply deliveries, among other survey services, have been performing in a period.
If the actual data released is greater than the forecast, it is suitable for the currency, while a lower result will bearish for the US dollar.
USDSGD Price Analysis
USDSGD Long term Outlook: Bullish
Monthly Chart

Monthly Resistance Levels: 1.41078, 1.46470
Monthly Support Levels: 1.32854, 1.30088, 1.34435, 1.38032
The bears were able to close below the bullish accumulation of 01 May 2020, and they took over the USDSGD market to the downside.
The bearish divergence is also supporting the bearish swing to the south, and the next support level that is exposed is the 11.34435.
The previous zones of 01 January 2020 and 01 March 2019 are the places where buyers established double bottom to push the bears back, and in a few months, we expect the price to reach there and the bulls to reject the bear’s pressure.
Weekly Chart

Weekly Resistance Levels: 1.41865, 1.43292, 1.45674, 1.46466
Weekly Support Levels: 1.35259, 1.3445, 1.38040, 1.39350
The Resistance levels are getting stronger by rejecting Bull’s advancement, and bears are taking out the support levels to create lower lows.
From the above chart, we expect the bearish surge to continue to the support level of 30 December 2019. A close below that zone will take the USDSGD further down.
In the coming weeks, we expect the Bulls to take back the market from the bears at the support zone of 1.35259 on 30 December 2019.
USDSGD Medium Term Outlook: Bullish
Daily Chart

Daily Resistance Levels: 1.43296, 1.42688, 1.41234, 1.39937
Daily Support Levels: 1.38742, 1.39180
The daily chart time frame has been dominated by the bears breaking the support zones of 1.41234 and 1.39180, pushing down the price of USDSGD.
The bear’s trend has been stable since the supply zones of 1.43296 and 1.39937 have not been breached.
A close below the 13 July 2020 low of 1.38742 gave the bears about 1.30% gain at the writing of this report.
Can the Bulls find support at the current level where the price is? Support at that level will take the price up to the previous support level of 1.39180 turned resistance.
H4 Chart
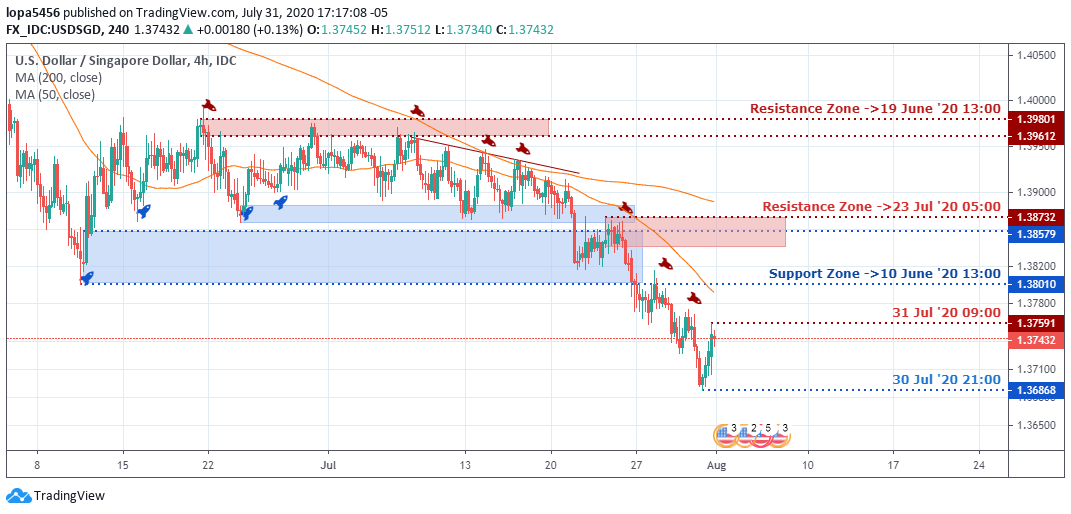
4Hour Resistance Levels: 1.39612, 1.39801
4Hour Support Levels: 1.39063, 1.38931, 1.38680, 1.38855, 1.38579, 1.38010
The Previous support level of 1.38712 of 23 July 2020 is acting as a resistance level against the Bull’s rally, thereby pushing the bears to surge lower than the 10 June 2020 support level of 1.38010 before finding another support 1.36668 of 30 July 2020.
If the recent bulls surge has strong momentum, we may see the bulls push back price into the zone of 1.38010.
Bullish Scenario:
The bullish support zones have been broken down in most of the time frames. The bulls need a strong fundamental that will attract the buyers to overturn the bears’ surge against them.
Bearish Scenario:
A bearish scenario is seen on the various time frames with a strong bearish momentum indicating the Singapore dollar rose favourably against the US dollar.
Generally, it will take a while before we see a reversal of trends because of the US economy’s crisis.
Conclusion
The new stimulus package is what will likely be the solution for the recovery of the US dollar. Singapore’s foreign exchange has been good in the currency market and the brokers, and investors have been having a steady flow of success for July.
The bears still can push the price down to a lower level of the trading week. Also, there is another possibility that further support can be established.

I've been a professional trader for over 5 years.
Currently I work as forex analyst for different investment companies.
- EURUSDWeekly outlook – 7th January 2022 - January 7, 2022
- BTCUSD – Weekly outlook for Bitcoin Price – 23rd December 2021 - December 24, 2021
- USDSGDWeekly outlook for Singapore Dollar – 17th Dec 2021 - December 17, 2021
Tagged with: usdsgd