
USDSGD Technical Analysis for binary options
Contents
Introduction
Last week, the USDSGD pair closed on a bearish note, forming a bearish accumulation pattern on the weekly chart. The Sing-dollar has been making attempts towards a recovery in strength; however, a fact still remains that the pair trades above the MA-65 and implies a stronger greenback.
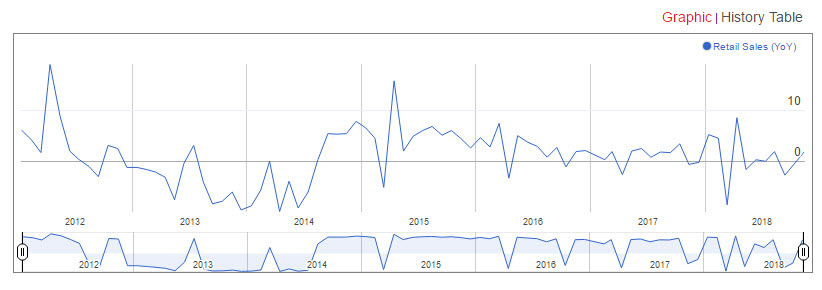
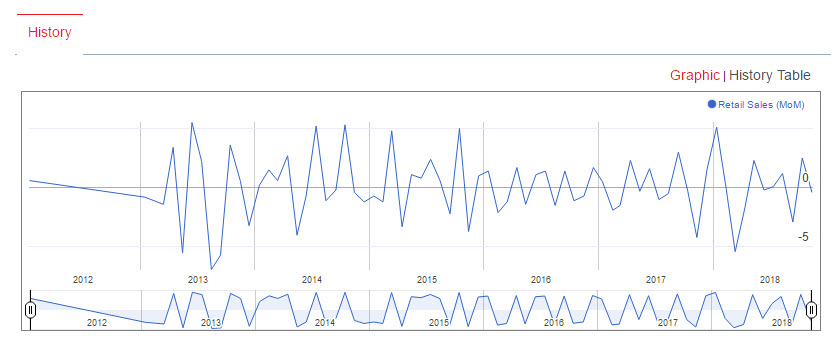
Retail Sales (YoY) & (MoM) Wednesday 12 December
Singapore’s Department of Statistics will be releasing the results of the Retail sales data tomorrow Wednesday 12 December. This is a representation of total consumer purchase from retail stores, showing relevant information about consumer spending. The Singapore retail sales add up to the consumption part of the nation’s GDP. An increasing retail sale indicates a growing economy. On the contrary, increase that’s greater than forecast may signal inflation.
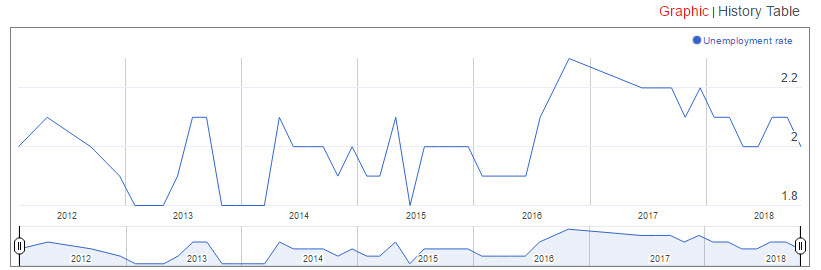
Unemployment rate (Q3) Thursday 13 December
The Ministry of Manpower will be releasing the unemployment rate on Thursday 13 December. It relates to people aged 15 years and above who did not work but were available for work and were actively seeking a job during the recommendation period.
Singapore 30 [SG30SGD]

The daily chart of the SG30SGD started off with a breakdown of bullish accumulation in combination with a double bearish accumulation on October 2. This confluence of technical bearish price setups resulted into a 9.6% decline in price of the Singapore30.
Within this bearish trend was a breakdown of bullish accumulation, highlighting rejection of an attempt towards a bullish price recovery.
A false break and breakout of bullish inside bar pattern was triggered on October 29, and 31, leading to a sudden up swing. The price chart from this point on entered into a series of higher lows by establishing support at 332.72, and 335.68, both of them triggered by false break patterns.
Recent price action patterns are formed on December 6 and 10, in the form of breakdown of bullish inside bar and bearish accumulation patterns. A price close above the bearish accumulation resistance should lead to a probable switch to a bullish trend.
The 4 hour chart also shows possibilities of a price break above a bearish accumulation resistance at 344.07. In the event of this, we project a 2.5% rise in trend with a risk of 0.98%.
The U.S Dollar Currency Index [DXY]
From the last published article, we identified a breakout of bearish accumulation pattern on the November 23 which established a support level at 96.37. This rising pattern indicates a strengthening U.S dollar.
Making a comparison between the price chart of the USD Index and the MACD oscillator, we observe a buildup of bullish hidden divergence, which further confirms a strong USD. As a protective measure, we’ll look out for a breakdown or breakout of this rising triangle for a binary options call trade.
Technical
USDSGD: Weekly Chart
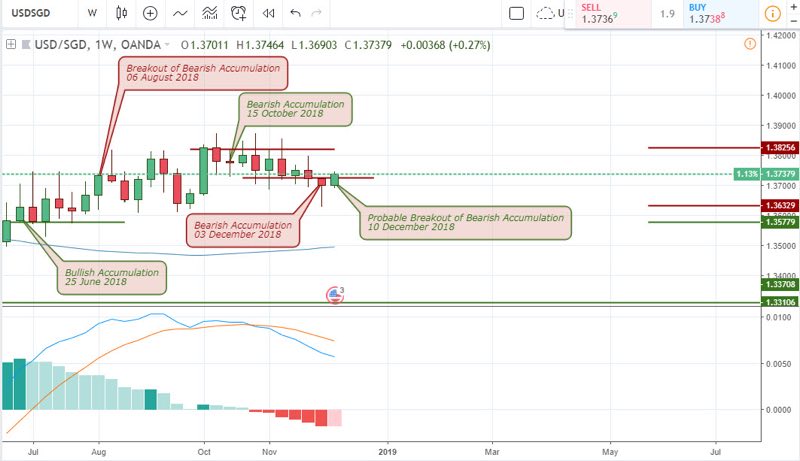
The weekly chart of the USDINR upon closing above the MA-65 triggers a bullish accumulation pattern on June 25. This setup leaves a strong support at 1.35779 with price making a 1.0% climb.
On October 15, a bearish accumulation pattern is formed setting up a resistance level at 1.38256. Another bearish accumulation resistance of 1.37227 is being established on December 3 and its currently being threatened.
USDSGD: Daily Timeframe
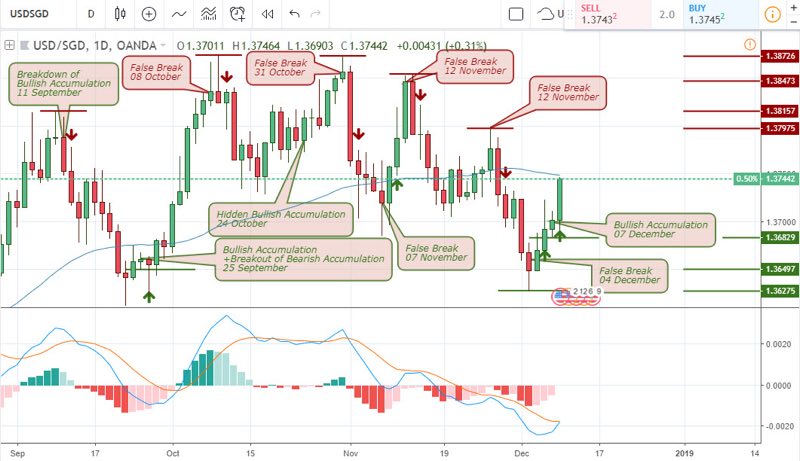
The above daily chart offer a lot of swing trading opportunities in binary options platforms like OlympTrade, starting from a breakdown of bullish accumulation on 11 September, which made a 1.0% drop. An opposite breakout of bearish accumulation in combination with a bullish accumulation pattern was triggered on 25 September, leading to a 1.55% price rally.
On the last day of October, a double top pattern was confirmed with a false break price pattern. The sell pressure was so great that it lead to price recoil, setting the pair up for a triple top pattern via another false break. This led to price moving down by another 1.0%.
Finally, in more recent times, price is setup for a bearish false break in combination with a bullish accumulation pattern.
4-HR Chart of the USDSGD
The above 4hour chart presents good swing trading opportunities on the XRPUSD chart. Starting from a breakdown of bullish accumulation pattern in combination with a bearish accumulation pattern on 28th November, the XRPUSD pair entered into a bearish trend.
After this bearish close below the MA-65, price entered into an expanding triangle pattern and later failed to a bearish close on 3rd December. A bearish accumulation pattern was later formed under the expanding triangle pattern preparing price for a final round of shorts. This jolt price into a 0.73% rally and we still expect it to make a first profit target of 1.0% where we lock in profits below the 1.36899 level before heading to 2.0% mark.
Conclusion
From the 4hour chart of the USDINR and the stable USD Index chart, we’ll notice that the Sing-dollar is relinquishing it’s gains as the USDINR triggers a double bullish accumualtion pattern on December 4. A failure of the bearish accumulation pattern on the weekly chart whould confirm the bullish trend. Meanwhile, in the short-term, we expect the up trend to contintu into the rest of the week.

I've been a professional trader for over 5 years.
Currently I work as forex analyst for different investment companies.
- EURUSDWeekly outlook – 7th January 2022 - January 7, 2022
- BTCUSD – Weekly outlook for Bitcoin Price – 23rd December 2021 - December 24, 2021
- USDSGDWeekly outlook for Singapore Dollar – 17th Dec 2021 - December 17, 2021
Tagged with: usdsgd