
USDSGD Technical Analysis for binary options
Contents
Introduction
Online brokers, such as Binomo, can see from the severe damage caused by the COVID-19 pandemic that retail sales dropped, generally affecting the purchasing power of individuals and firms.
The fear of the second wave is already threatening the global economy’s recovery process, and investors hope that the recent crisis is contained before it escalates beyond control.
Singapore Fundamentals
Singapore Residential Property Price Index:
The housing report from the Singapore property has not been encouraging; it has been heading south amid the COVID-19 pandemic. As in last month’s report, we can see that the prices of homes dropped by 1.1%.
As of this quarter, the Landing price declined by -0.9% against the previous quarter of -2.7%. These declines also affect the non-landed property in the first quarter, -0.6% and in the second quarter by -1%.
U.S. Fundamentals
Unemployment Claims: Forecast 1280K Previous 1300K.
The recent surge in the second wave of COVID-19 pandemic crisis facing the USA and its economy may lead to another forceful lockdown if a severe step is taken. Some states have to shut down some sectors to reduce the spread in the number of affected cases.
For every new week, data is collected on the number of persons who officially file for insurance for the first time. Data outcome is expected to fluctuate in the coming weeks, following the COVID-19 challenge.
The data of unemployment claims are also useful to decision-makers and use the outcome as an influencer for decisions regarding the monetary policies.
If the number of individuals who file for unemployment should be lower than the forecast, then it is suitable for the US currency, but if the actual data is higher than forecast, then it isn’t good for the currency.
USDSGD Price Analysis
USDSGD Long term Outlook: Bullish
Monthly Chart

Monthly Resistance Levels: 1.41078, 1.46470
Monthly Support Levels: 1.32854, 1.30088, 1.34435, 1.38032
The Singapore dollar has not seen much volatility in her foreign exchange this recent month. The high 1.46470 of 02 March 2020 is peak resistance for the year so far, and the bears were able to push back the price to the support level of 1.38032.
If the bears can close below the support level, they can push the price down to 1.34435 double bottom support of 01 January 2019.
Failure on the side of bears at the support level will attract the bulls to push back USDSGD price to the resistance level of 11.41078 and possibly above it.
Weekly Chart

Weekly Resistance Levels: 1.41865, 1.43292, 1.45674, 1.46466
Weekly Support Levels: 1.35259, 1.3445, 1.38040, 1.39350
The Singapore dollar was favorable in the foreign exchange market as it made its’ gains against the US market in the past weeks after the resistance zone of 16 March 2020 push down price from 1.46466 to the low of 1.39350.
The bears have to close below the support level for the continuation of the trend to expose the 1.35259 support level.
In the past six weeks, the support level has not been taking out, making it difficult for the bears to dominate the market. If the bulls can build momentum in the coming weeks, we can see a surge in the market’s upside.
USDSGD Medium Term Outlook: Bullish
Daily Chart

Daily Resistance Levels: 1.43296, 1.42688, 1.41234, 1.39937
Daily Support Levels: 1.38000, 1.38742, 1.39180
The Singapore dollar has been having a good gain in the foreign exchange market for the past days since the pair broke out below the descending triangle of 07 May 2020.
The Singapore dollar gained about 3.37% against the US dollar from the high of 25 May 1.42688 to the lowest low of 1.38000.
As you can also see that in recent times another bearish descending triangle is forming in line with the descending trend line as we continue to have a lower highs and a flat support zone respectively from 22 June 2020 high of 1.39937 and 13 July 2020 low of 1.38742.
If the bears can close below the support zone of 1.38742, the Singapore broker may see a continuation of the downtrend.
However, the financial market is not that predictable in this era of the COVID-19 pandemic.
A failure from the bears to take price below the support levels of 1.38742 and 1.38000 will give rise to a bullish surge in the nearest future.
H4 Chart
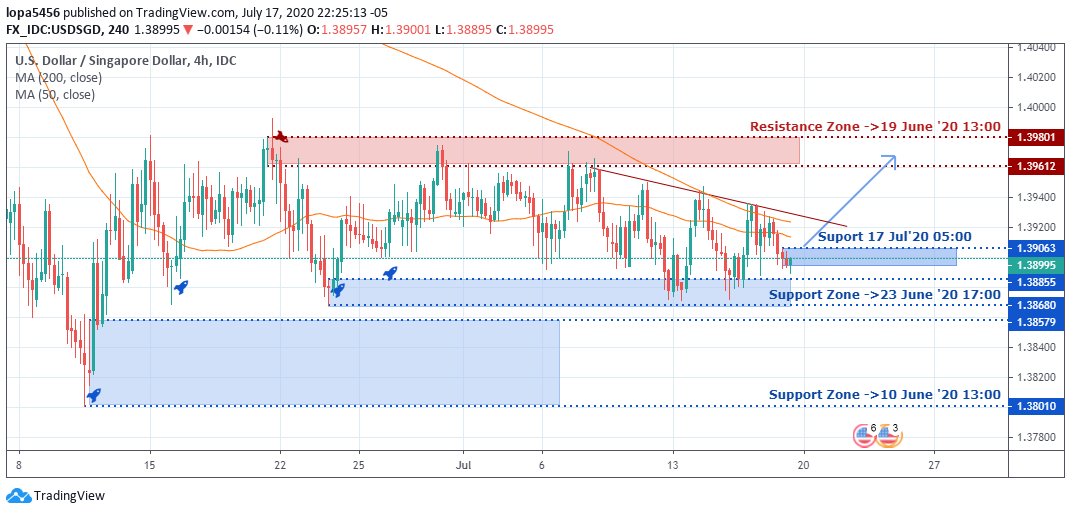
4Hour Resistance Levels: 1.39612, 1.39801
4Hour Support Levels: 1.39063, 1.38931, 1.38680, 1.38855, 1.38579, 1.38010
The chart above on the H4 time frame shows us a ranging market after the bullish rally that was stopped at the 1.39801 resistance zone on 19 June 2020. The bears and the bulls have been pushing themselves between the 1.39801 and 1.38680 levels in the most recent times on H4.
With the trend line’s aid, you can see the highs are getting lower after an upsurge. If the bears’ move can go below the 1.38680 support level, we may see the exposure of 1.38010 levels been reached in the future.
Note that if the demand zone is filled and there are more substantial indications in the market, we will likely see a bullish surge that will take price up to the 1.39612 level of resistance.
Bullish Scenario:
Generally, on all the time frames, you will notice that the bullish momentum is weak. For the Bulls to have control of the market, they have to control the H4 time frame with a strong rally above the 4Hour resistance levels of 1.39612 and 1.39801.
Bearish Scenario:
The Bears have dominated the market in this period after the gradual reopening of the global economy since COVID-19 closed the global trading market. A break below the descending triangle on the daily time frame will attract more sellers into the market, which will be good for the Singapore foreign exchange.
Conclusion
The Asian countries have had lower numbers of COVID-19 new cases compared to that of the North Americans that are having increased numbers of new cases. Singapore brokers have to weigh the market sentiment to be on the right side of the market in the coming days.
A clear breakout of resistance zone or below support on the H4 will be best for traders considering recent market fluctuations.

I've been a professional trader for over 5 years.
Currently I work as forex analyst for different investment companies.
- EURUSDWeekly outlook – 7th January 2022 - January 7, 2022
- BTCUSD – Weekly outlook for Bitcoin Price – 23rd December 2021 - December 24, 2021
- USDSGDWeekly outlook for Singapore Dollar – 17th Dec 2021 - December 17, 2021