
USDSGD Technical Analysis for Singapore binary options
Contents
Introduction
With the US having more of the new cases of COVID-19 and the fear of the second lockdown gets underway, some Asian countries have also moved for the further lockdown to contain any localized outbreaks.
The COVID-19 second wave is of concern to the Singapore brokers because most of the business activities have shrunk, and it is not suitable for the Singapore foreign exchange.
Singapore Fundamentals
The Singapore Retail sales have been dropping for the past 16 months, among which the COVID-19 played a part. The sales slumped by 21.5% after a downwardly revised of 31.3% in April.
The COVID-19 and the effects of the pandemic has brought more drops in different sales like recreational goods and books (-74.2% vs -63.8%), departmental stores (-93.4% vs -82.3%), furniture & household equipment (-64.2% vs -38.4%) among others. The sales in supermarkets increased from (56.1% vs. 75.2%).
U.S. Fundamentals
Producer Price Index
The data will calculate the variation in the price of goods and services that are finished products and that are sold by producers.
The Bureau of Labor Statistics excludes food and energy from the core producer price index.
Forecast 0.1% while Previous is –0.1%
USDSGD Technical Analysis
USDSGD Long term Outlook: Bullish
Monthly Chart

Monthly Resistance Levels: 1.41078, 1.46470
Monthly Support Levels: 1.32854, 1.30088, 1.34435, 1.38032
The new month starts on a slow start as the Singapore economy is gradually picking up after going through a pandemic crisis. Singapore brokers can only hope for a faster recovery in the foreign exchange market.
Last month candlestick closed in a bearish form showing that the Singapore dollar gains against the US dollar at the close of the month.
As the new month begins, the rejection of price at the 1.38032 levels could be telling us that the bulls want to push the price up.
Weekly Chart

Weekly Resistance Levels: 1.41865, 1.43292, 1.45674, 1.46466
Weekly Support Levels: 1.35259, 1.3445, 1.38040, 1.39350
After weeks of the bears controlling the market, the USDSGD price found support when the 1.39350 level rejected the bears’ push. The hidden bullish divergence on 29th June 2020 shows pressure from the demand zone.
Also, the 50 Moving Average may act as dynamic support for the bulls to rally up to the resistance zone of 1.43292.
USDSGD Medium Term Outlook: Bullish
Daily Chart

Daily Resistance Levels: 1.39751, 1.42802
Daily Support Levels: 1.38046
Singapore’s foreign exchange was favourable to Singapore brokers after the bears took control of the market from 18th May 2020.
After the price rallied up from the support level, we can see another bearish divergence setup built from the resistance zone of 1.39751 that may take the price down.
The support of 10th June 2020 (1.39751) is not a strong confirmation that the bulls have been in control. However, if the price of USDSGD closes above the 1.39751, it will likely expose the next resistance level of 1,42802.
H4 Chart
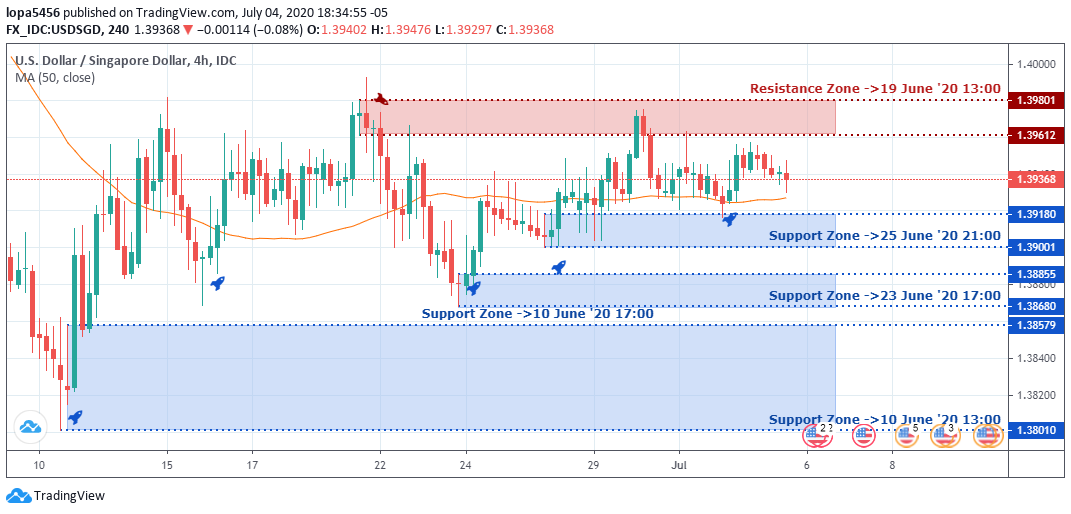
4Hour Resistance Levels: 1.39612, 1.39801
4Hour Support Levels: 1.38579, 1.38010, 1.38680, 1.38855, 1.39001, 1.39180
On the H4 time frame, we can see that the resistance level has been within the 1.39612 and 1.39801 zones while the support levels have been rising.
The USDSGD has been rising from the lowest trough of 1.38010, 1.38579, and 1.39001, respectively, forming an ascending triangle.
In the nearest future, we may see a break out above the resistance line or another rejection of price.
Bullish Scenario:
Bullish momentum is building up in the H4 time frame as we keep seeing higher lows. Should we get a close above the resistance zone, more buyers enter a long position.
Bearish Scenario:
On the daily time frame, the bears have been in control of the market before losing the steam. We expect the bear’s pressure to continue after the correction of that swing.
However, if the bears fail to push the price further down, we may finally see the bulls finally taking over in the coming days.
Conclusion
However, a close above the H4 resistance can place the bulls in a bullish bias in the coming days.
The bears need to take out the support level on the daily time frame before they can have a continuation of a downtrend.
Investors won’t mind a clear direction of the trend to avoid the uncertainty in the market.

I've been a professional trader for over 5 years.
Currently I work as forex analyst for different investment companies.
- EURUSDWeekly outlook – 7th January 2022 - January 7, 2022
- BTCUSD – Weekly outlook for Bitcoin Price – 23rd December 2021 - December 24, 2021
- USDSGDWeekly outlook for Singapore Dollar – 17th Dec 2021 - December 17, 2021