
Weekly Outlook of BTCUSD – Bitcoin price
Contents
BTC/USD started the week with a slight consolidation on Sunday 18th. But on the 19th there was a breakout. The breakout has led to a 3.53% appreciation within a span of 2 days. This marks a continuation of the previous week’s bullish trend, which is a confirmation that the bitcoin price is regaining its strength after a month long decline in January.
Currently, bitcoin price seems to be gaining strength daily against its US dollar counterpart.
Below is a more in-depth analysis of the BTCUSD pair:
BTCUSD 30 minutes chart

From the 30 minute bitcoin chart above, it is evident that the pair started the week with a small consolidation on Sunday, 18th evident from the symmetrical triangle pattern as shown. However, after the breakout on 19th, the prices quickly went up even breaking the previous week’s resistance level of 11065.
Moving average: the Moving average is showing that the BTCUSD is in a strong bullish trend and the week seems to have started well. The prices have generally remained above the MA, except for some minor retracements which are occurring during the day and it is very normal in any established trend. This is a great signal to buy bitcoin.
BTCUSD daily chart
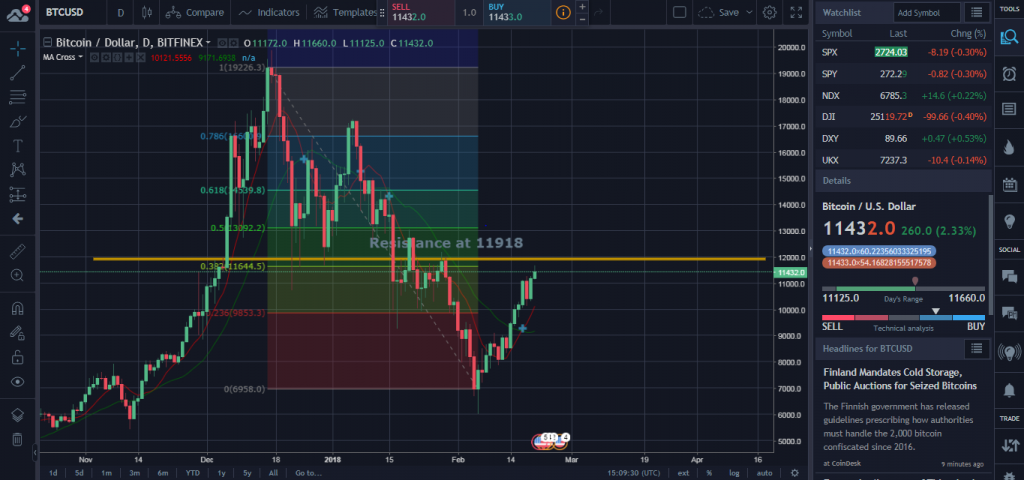
By applying the Fibonacci retracement on the previous month’s long decline of bitcoin price, we can see that the prices have moved up to 38.2% retracement level. This is a very great indicator that the prices may be headed back to their previous levels in December.
Actually, by applying the MA Cross in the above bitcoin chart, it confirms that the current bullish trend is quite strong since the cross already happened and the prices are now trending above both indicators.
This should give the investors more courage of buying bitcoin with targeting the 50% retracement at 13057.9.
However, before the price gets to the 50% retracement level, they will have to break through the resistance level at 11918.8. Previously (last month), the prices had tried breaking out at this point, only to rebounce heading for the all time low of 6911.0. Therefore, the 11918.8 level will be a testing point for bitcoin price in its quest to regain its lost glory. If it breaks though this level successfully, then traders can rest assured that it will hit the 50% retracement level and even go past it.
Best level for buy order stops
Since this is a perfect time to place a buy order, it would be wise to use stop levels, especially due to the resistance level at 11918.8.
I would advice a long term buy order with a stop loss level set at 9833.1, which is the 23.6% retracement level. Then in the mean time, you could set your take profit at 13102.0, which is the 50% retracement level.
Our Recommended Bitcoin Broker to trade BTCUSD: IQ Option
Best Regulated Broker: IQ Option

IQ Option is the world’s leading EU regulated financial broker based with a revolutionary platform for all traders. Very popular for crypto trading. Read IQOption review
- Best Trading App for Binary Options
- Minimum Deposit of only $10
- Minimum Trade of $1
- Trusted Broker
- $10,000 Virtual Funds ( Demo Account )
- Quick Withdrawals
- Outstanding Platform
- Weekly Tournaments
- Gain up to 98%*
DISCLAIMER

I've been a professional trader for over 5 years.
Currently I work as forex analyst for different investment companies.
- EURUSDWeekly outlook – 7th January 2022 - January 7, 2022
- BTCUSD – Weekly outlook for Bitcoin Price – 23rd December 2021 - December 24, 2021
- USDSGDWeekly outlook for Singapore Dollar – 17th Dec 2021 - December 17, 2021