
USD/SGD Weekly Analysis for Singapore Broker
Contents
Introduction
The previous week, which was in a bearish trend, transitioned into a bullish trend, causing the SGD to USD exchange rate to jet upwards into a series of consecutive bars on the daily chart.
Asia/Singapore Fundamentals
In the news this week, major Asian Stock markets gradually ease into bearish territories, as their prices trade under the 200-period moving average. China has the worst in terms of ratio has 88% of its companies trading below the 200-period moving average of the daily chart. Following close to China is the Philippines and Singapore.
According to Singapore’s Business Expectations of the manufacturing sector released on the 31st of July, the actual result came out 7.00 compared to its previous release of 13.0. A positive sign indicates a positive balance and upward trend, while the opposite is a downward trend. Looking at the actual release, which is lower than expected reading compared to the previous results, this implies a bearish for the Singdollar as most Singapore broker/s pay attention to these readings.
Technical
Similar to previous reviews we’ve to handle on this website; we adopt a top-down approach towards analyzing the USDSGD currency pair.
USDSGD: Monthly Chart

After breaking below the 65-period moving average, the USDSGD currency pair went into a series of candlesticks, forming a series of Inside bar patterns. Price breaks out of the inside bar accumulation patterns forming a series of consecutive bullish bars.
USDSGD: Weekly Chart
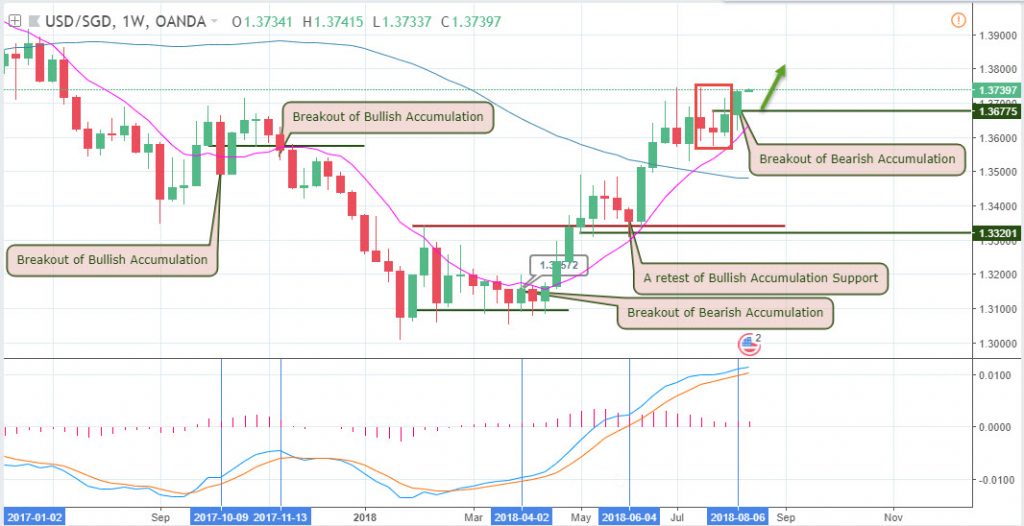
The weekly chart illustration above makes it clear to see the inner workings of the monthly chart, as it triggers a breakout of a bearish accumulation pattern on 02-04-2018. Moving forward, price later on 04-06-2018 used a bullish accumulation support as a springboard to send the price skyrocketing.
USDSGD: Daily Timeframe
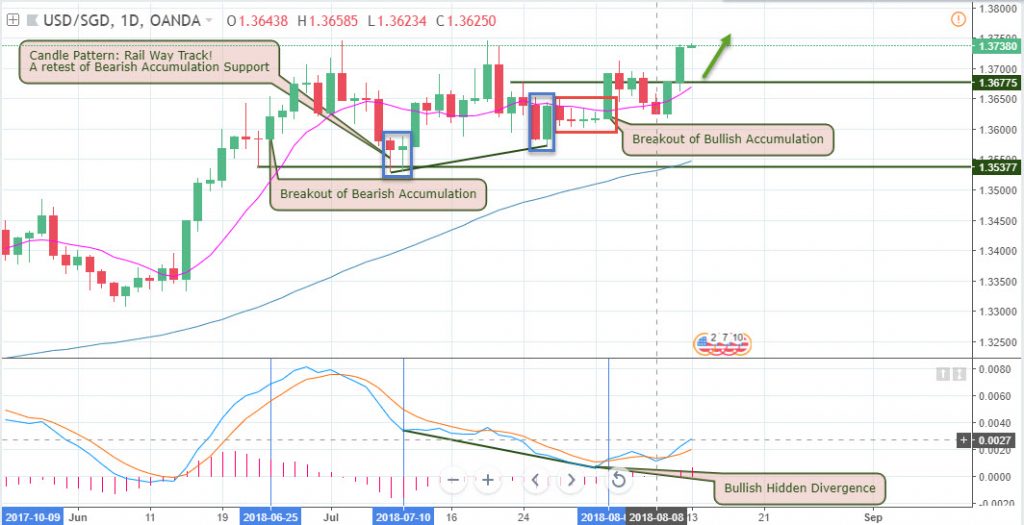
From the daily chart time frame shown above, we’ll notice a cluster of price action patterns, which includes, two railway track patterns, and both bearish & bullish accumulation phase. Price does a bullish breakout of the accumulation phases, later to retest the accumulation support zone.
USDSGD: 4-HOURLY Timeframe
On the four hourly chart, a huge Gartley Harmonic pattern is formed signalling a bullish trend that’s triggered by a bullish breakout of a bearish accumulation pattern on 09-08-2018. A similar bearish accumulation pattern was also formed on 30-07-2018, which later ended with a breakout of the resistance area. Also featured on the chart is a bullish hidden divergence pattern formed around the same bearish accumulation pattern on 09-08-2018, and more recently is a bullish accumulation pattern.
USDSGD: 2-Hour Chart
For a closer zoom into the chart is a similar breakout pattern on the 2-hourly chart. This first started off as a bearish trend after a breakout of a bullish accumulation pattern, which later transitioned into a bullish trend. As a bullish accumulation pattern establishes a support at 1.3700, price jolts higher.
Projection and Conclusion
All said, the previous week has been bullish, and there’s a high probability of price continuing in the same direction this week. As this week winds up to a close, the pair triggers a bearish regular divergence pattern. This could change the trend completely or cause a huge correction of the bullish trend.
Our Recommended Singapore Broker to trade USD/SGD
Best Regulated Broker: IQ Option

IQ Option is the world’s leading EU regulated financial broker based with a revolutionary platform for all traders. Very popular for crypto and USD/SGD trading. Read IQ Option Singapore review
- Best Trading App for Binary Options
- Minimum Deposit of only $10
- Minimum Trade of $1
- Trusted Broker
- $10,000 Virtual Funds ( Demo Account )
- Quick Withdrawals
- Outstanding Platform
- Weekly Tournaments
- Gain up to 98%*
Best Binary Options Broker: Olymp Trade

Olymp Trade is an award winning binary options broker with an excellent trading platform support and education tools. Read Olymp Trade Review
- Risk-Free Trades
- Minimum Deposit of only $10
- Max. 90% Payout
- $10,000 Free Demo account
- Free TrainingEducation : 18 Indicators, 7 strategies and 28 webinars 25% Deposit s
- Certified Platform
- Quick withdrawals
Best Binary Bonus: Binomo

Binomo is a regulated binary broker with a wide range of assets to trade and amazing promotions ( bonus, tournaments prizes,..) .Read Binomo Review
- 25% Deposit Bonus ( 100% Bonus VIP accounts )
- Minimum Deposit of only $10
- Minimum Trade of $1
- Max. 95% Payout
- $1,000 Virtual Funds ( Demo Account )
- Weekend trading
- Free training
DISCLAIMER

I've been a professional trader for over 5 years.
Currently I work as forex analyst for different investment companies.
- EURUSDWeekly outlook – 7th January 2022 - January 7, 2022
- BTCUSD – Weekly outlook for Bitcoin Price – 23rd December 2021 - December 24, 2021
- USDSGDWeekly outlook for Singapore Dollar – 17th Dec 2021 - December 17, 2021