
While trading binary options on the smaller time frame like 60-Second or 5 minute, traders often forget that the price in the global foreign exchange market fluctuates in waves. A chart that looks oversold in the 5 minute charts can look overbought on the 60 minutes (H1) chart, and vice-versa.
Today, we are going to take a look at a very accurate binary options strategy that combines the power of two time frames in order to offer better odds of winning.
This strategy works best when the Forex market is very active, especially during the London and New York trading sessions. If you want the best results, it is highly recommended that you apply this strategy during the last four hours of London session, because during this time the New York market also remains open, which provides the highest market liquidity.
Preparing Charts for the H1 – M5 Multi Time Frame Stochastic Strategy
We are using the MetaTrader 4 trading platform for this example, but you can use this strategy with your broker’s online charting tools or any other trading platform.
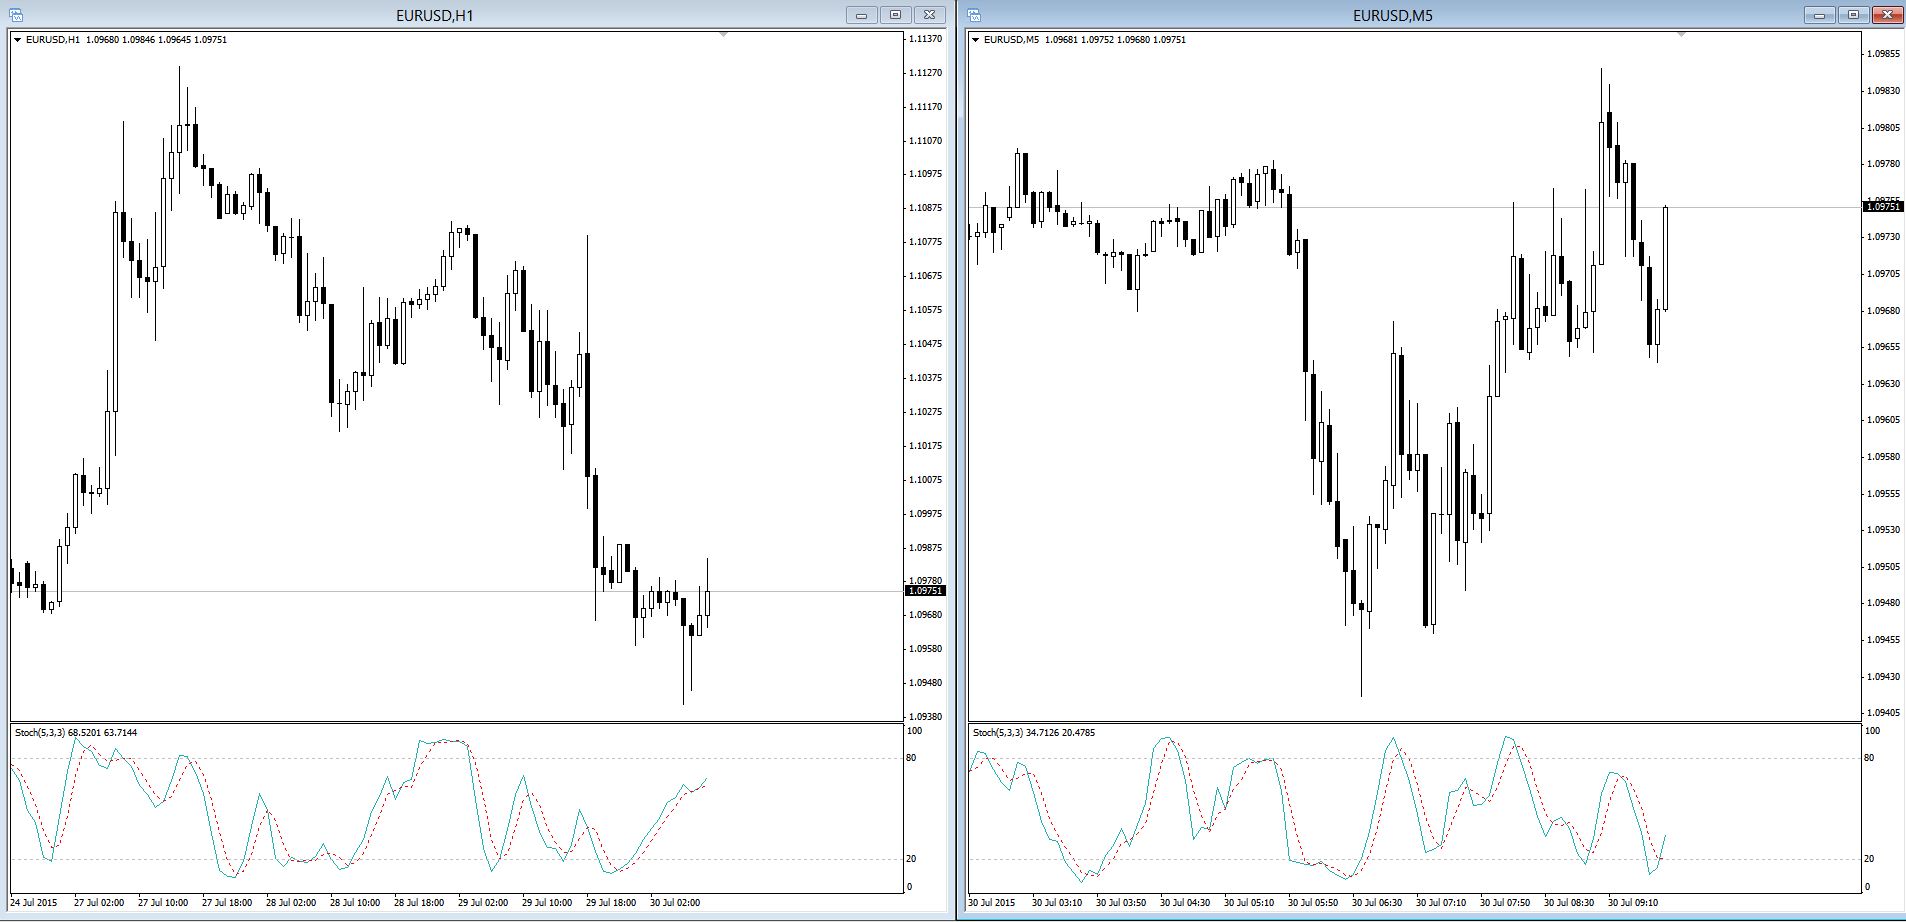
In your charting software (desktop or web based), open two charts of the currency pair you wish to trade and put them side by side. The period of one of the charts should be 60 minutes or 1 hour (H1) and the other chart’s period should be 5 minutes (M5).
Add the Stochastic technical indicator on both charts with default settings. It is very important that you leave the %K and %D at 5 and 3, respectively.
How to Trade the H1 – M5 Multi Time Frame Stochastic Strategy
Since this strategy works best when there is ample market liquidity and an established trend, you should always place your orders in the direction of the Stochastic indicator on the H1 chart.
When the Green line is above the dotted Red line in the Stochastic indicator, it means the trend in the H1 chart is up. By contrast, when the Green line is below the dotted Red line, it shows that the trend is currently down.
Once you have identified a trend in the H1 chart, now you have to wait for a good entry signal on the M5 chart.
The best way to place CALL order with this Multi Time Frame strategy is to wait for the M5 chart to become oversold during an uptrend in the H1 chart. Similarly, you should wait for the M5 chart to become overbought when the H1 chart is showing a downtrend before placing a PUT order with your binary options broker.
In the example setup above, the EUR/USD on the H1 is clearly showing an uptrend as far as the Stochastic indicator is concerned. Hence, if you placed a CALL order when the Stochastic indicator on the M5 chart was oversold (a few bars back), then you would have made a nice profit within five minutes!
A note of caution for more conservative traders: you may want to wait for the M5 Green Stochastic line to cross above the M5 dotted Red line before placing the order.
Recommended Binary Options Brokers
| Broker | Max.Bonus | Min.Deposit | Rating | Good Points | Max.Payout | USA | Regulation | |
|---|---|---|---|---|---|---|---|---|
 | Free $10,000 Demo Account | $10 | 5.0 | Top Regulated Broker $10 Min.Deposit Free Demo Acc. #1 Crypto app | 98% | Not | - | VISIT IQOPTION IQOption Review |
 | Free $10,000 Demo Account | $10 | 4.8 | Best Platform $10 Min.Deposit Free Demo Acc. Quick Withdrawals | 90% | Not | International Financial Commission | VISIT OLYMP TRADE Olymp Trade Review |
Tagged with: Binary Options Strategy • Stochastic